SHELL PLC - 1H - Technical analysis published on 02/10/2025 (GMT)
- 134
- 0
Click here for a new analysis!
- Timeframe : 1H
- - Analysis generated on
- Status : INVALID
Summary of the analysis

Additional analysis
Quotes
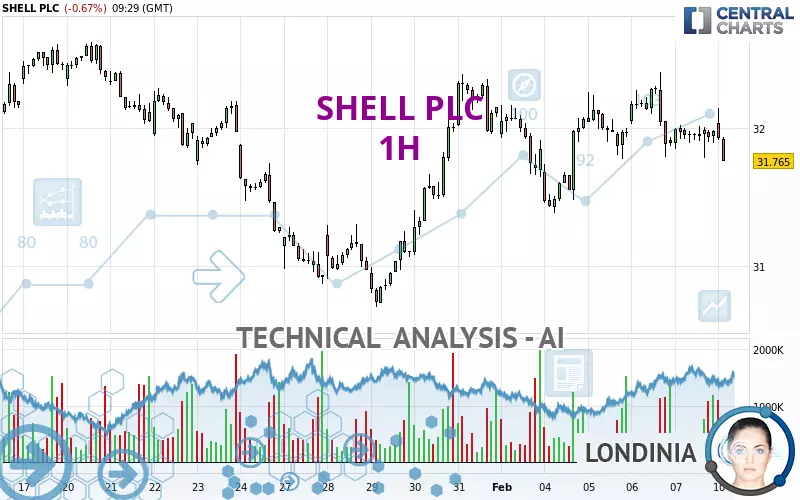
The SHELL PLC rating is 31.765 EUR. The price is lower by -0.67% since the last closing and was traded between 31.760 EUR and 32.145 EUR over the period. The price is currently at +0.02% from its lowest and -1.18% from its highest.The Central Gaps scanner detects a bullish gap which is a sign that buyers have taken the lead in the very short term.
Opening Gap UP
Type : Bullish
Timeframe : Openning
A study of price movements over other periods shows the following variations:
Near a new HIGH record (1st january)
Type : Bullish
Timeframe : Weekly
Near a new LOW record (1 month)
Type : Bearish
Timeframe : Weekly
Technical
A technical analysis in 1H of this SHELL PLC chart shows a slightly bearish trend. Only 57.14% of the signals given by moving averages are bearish. This slightly bearish trend is reinforced by the strong signals currently being given by short-term moving averages. The Central Indicators market scanner currently does not detect any result that concerns moving averages.
The probability of a further decline is moderate given the direction of the technical indicators.
Caution: the Central Indicators scanner currently detects an excess:
CCI indicator is oversold : under -100
Type : Neutral
Timeframe : 1 hour
Williams %R indicator is oversold : under -80
Type : Neutral
Timeframe : 1 hour
Pivot points : price is under support 1
Type : Neutral
Timeframe : 1 hour
SuperTrend indicator bearish reversal
Type : Bearish
Timeframe : 1 hour
Price is back under the pivot point
Type : Bearish
Timeframe : Weekly
The Central Patterns scanner, which studies chart patterns, resistances and supports, has identified this signal:
Near support of triangle
Type : Bullish
Timeframe : 1 hour
The Central Candlesticks scanner, specialised in Japanese candlesticks, did not identify any signals.
| S3 | S2 | S1 | Price | R1 | R2 | R3 | |
|---|---|---|---|---|---|---|---|
| ProTrendLines | 31.016 | 31.384 | 31.610 | 31.765 | 31.787 | 32.212 | 32.460 |
| Change (%) | -2.36% | -1.20% | -0.49% | - | +0.07% | +1.41% | +2.19% |
| Change | -0.749 | -0.381 | -0.155 | - | +0.022 | +0.447 | +0.695 |
| Level | Minor | Intermediate | Major | - | Intermediate | Minor | Major |
Pivot points can also be used to set your price objectives. Here is the price situation in relation to pivot points:
| Pivot points | S3 | S2 | S1 | PP | R1 | R2 | R3 |
|---|---|---|---|---|---|---|---|
| Standard | 31.595 | 31.690 | 31.835 | 31.930 | 32.075 | 32.170 | 32.315 |
| Camarilla | 31.914 | 31.936 | 31.958 | 31.980 | 32.002 | 32.024 | 32.046 |
| Woodie | 31.620 | 31.703 | 31.860 | 31.943 | 32.100 | 32.183 | 32.340 |
| Fibonacci | 31.690 | 31.782 | 31.838 | 31.930 | 32.022 | 32.078 | 32.170 |
| Pivot points | S3 | S2 | S1 | PP | R1 | R2 | R3 |
|---|---|---|---|---|---|---|---|
| Standard | 30.422 | 30.903 | 31.442 | 31.923 | 32.462 | 32.943 | 33.482 |
| Camarilla | 31.700 | 31.793 | 31.887 | 31.980 | 32.074 | 32.167 | 32.261 |
| Woodie | 30.450 | 30.918 | 31.470 | 31.938 | 32.490 | 32.958 | 33.510 |
| Fibonacci | 30.903 | 31.293 | 31.534 | 31.923 | 32.313 | 32.554 | 32.943 |
| Pivot points | S3 | S2 | S1 | PP | R1 | R2 | R3 |
|---|---|---|---|---|---|---|---|
| Standard | 28.128 | 29.122 | 30.638 | 31.632 | 33.148 | 34.142 | 35.658 |
| Camarilla | 31.465 | 31.695 | 31.925 | 32.155 | 32.385 | 32.615 | 32.845 |
| Woodie | 28.390 | 29.253 | 30.900 | 31.763 | 33.410 | 34.273 | 35.920 |
| Fibonacci | 29.122 | 30.081 | 30.673 | 31.632 | 32.591 | 33.183 | 34.142 |
Numerical data
The following is the status of the technical indicators and moving averages at the time of publication of this technical analysis:
| RSI (14): | 38.93 | |
| MACD (12,26,9): | -0.0190 | |
| Directional Movement: | -5.937 | |
| AROON (14): | -92.857 | |
| DEMA (21): | 31.958 | |
| Parabolic SAR (0,02-0,02-0,2): | 32.243 | |
| Elder Ray (13): | -0.099 | |
| Super Trend (3,10): | 32.280 | |
| Zig ZAG (10): | 31.795 | |
| VORTEX (21): | 0.9780 | |
| Stochastique (14,3,5): | 19.85 | |
| TEMA (21): | 31.900 | |
| Williams %R (14): | -96.06 | |
| Chande Momentum Oscillator (20): | -0.090 | |
| Repulse (5,40,3): | -0.7860 | |
| ROCnROLL: | 2 | |
| TRIX (15,9): | 0.0040 | |
| Courbe Coppock: | 1.25 |
| MA7: | 31.958 | |
| MA20: | 31.859 | |
| MA50: | 31.041 | |
| MA100: | 30.832 | |
| MAexp7: | 31.910 | |
| MAexp20: | 31.965 | |
| MAexp50: | 31.918 | |
| MAexp100: | 31.832 | |
| Price / MA7: | -0.60% | |
| Price / MA20: | -0.30% | |
| Price / MA50: | +2.33% | |
| Price / MA100: | +3.03% | |
| Price / MAexp7: | -0.45% | |
| Price / MAexp20: | -0.63% | |
| Price / MAexp50: | -0.48% | |
| Price / MAexp100: | -0.21% |
News
The latest news and videos published on SHELL PLC at the time of the analysis were as follows:
- Transaction in Own Shares
- Transaction in Own Shares
- Transaction in Own Shares
- Transaction in Own Shares
- Director/PDMR Shareholding
About author
Online


Add a comment
Comments
0 comments on the analysis SHELL PLC - 1H