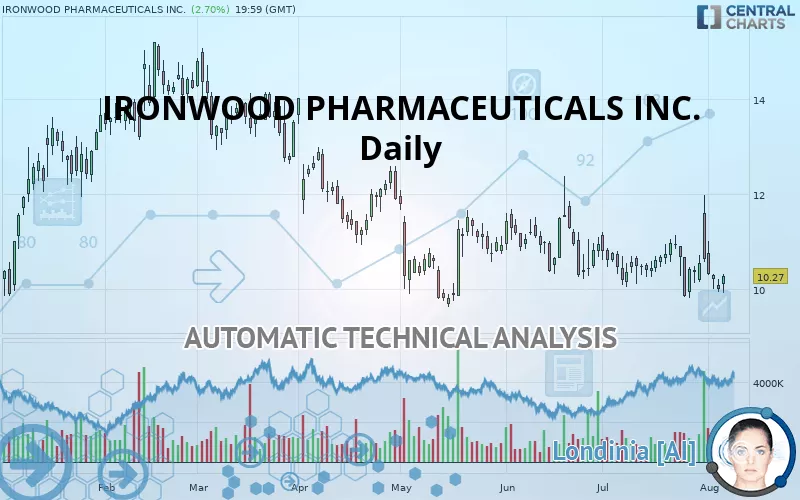
IRONWOOD PHARMACEUTICALS INC. - Daily - Technical analysis published on 08/07/2019 (GMT)
- 352
- 0
- Who voted?
Click here for a new analysis!
- Timeframe : Daily
- - Analysis generated on
- Status : TARGET REACHED

Summary of the analysis

Additional analysis
Quotes
IRONWOOD PHARMACEUTICALS INC. rating 10.27 USD. On the day, this instrument gained +2.70% with the lowest point at 9.90 USD and the highest point at 10.30 USD. The deviation from the price is +3.74% for the low point and -0.29% for the high point.A bullish opening was detected by the Central Gaps scanner. Buyers are trying to impose a bullish momentum in the very short term.
Bullish opening
Type : Bullish
Timeframe : Openning
Here is a more detailed summary of the historical variations registered by IRONWOOD PHARMACEUTICALS INC.:
Near a new LOW record (1st january)
Type : Bearish
Timeframe : Weekly
Near a new LOW record (1 month)
Type : Bearish
Timeframe : Weekly
Technical
Technical analysis of this Daily chart of IRONWOOD PHARMACEUTICALS INC. indicates that the overall trend is strongly bearish. The signals given by moving averages are 92.86% bearish. This strong bearish trend is confirmed by the strong signals currently being given by short-term moving averages. The Central Indicators market scanner currently does not detect any result that concerns moving averages.
An assessment of technical indicators does not currently provide any relevant information on the direction of future price movements.
But beware of excesses. The Central Indicators scanner currently detects this:
CCI indicator is oversold : under -100
Type : Neutral
Timeframe : Daily
Williams %R indicator is oversold : under -80
Type : Neutral
Timeframe : Daily
Pivot points : price is over resistance 1
Type : Neutral
Timeframe : Daily
Parabolic SAR indicator bearish reversal
Type : Bearish
Timeframe : Daily
Price is back under the pivot point
Type : Bearish
Timeframe : Daily
An analysis of the price chart with the Central Patterns scanner (detector of chart patterns and resistances and supports) shows several results that can have an impact on the price change:
Horizontal support is broken
Type : Bearish
Timeframe : Daily
Support of triangle is broken
Type : Bearish
Timeframe : Daily
The Central Candlesticks scanner which studies Japanese candlesticks did not detect anything.
| S3 | S2 | S1 | Price | R1 | R2 | R3 | |
|---|---|---|---|---|---|---|---|
| ProTrendLines | 7.80 | 9.26 | 9.85 | 10.27 | 11.92 | 13.27 | 14.46 |
| Change (%) | -24.05% | -9.83% | -4.09% | - | +16.07% | +29.21% | +40.80% |
| Change | -2.47 | -1.01 | -0.42 | - | +1.65 | +3.00 | +4.19 |
| Level | Intermediate | Major | Major | - | Major | Intermediate | Major |
Pivot points can also be used to set your price objectives. Here is the price situation in relation to pivot points:
| Pivot points | S3 | S2 | S1 | PP | R1 | R2 | R3 |
|---|---|---|---|---|---|---|---|
| Standard | 9.60 | 9.76 | 9.88 | 10.04 | 10.16 | 10.32 | 10.44 |
| Camarilla | 9.92 | 9.95 | 9.97 | 10.00 | 10.03 | 10.05 | 10.08 |
| Woodie | 9.58 | 9.75 | 9.86 | 10.03 | 10.14 | 10.31 | 10.42 |
| Fibonacci | 9.76 | 9.87 | 9.93 | 10.04 | 10.15 | 10.21 | 10.32 |
| Pivot points | S3 | S2 | S1 | PP | R1 | R2 | R3 |
|---|---|---|---|---|---|---|---|
| Standard | 7.53 | 8.75 | 9.52 | 10.74 | 11.51 | 12.73 | 13.50 |
| Camarilla | 9.73 | 9.92 | 10.10 | 10.28 | 10.46 | 10.65 | 10.83 |
| Woodie | 7.30 | 8.64 | 9.29 | 10.63 | 11.28 | 12.62 | 13.27 |
| Fibonacci | 8.75 | 9.51 | 9.98 | 10.74 | 11.50 | 11.97 | 12.73 |
| Pivot points | S3 | S2 | S1 | PP | R1 | R2 | R3 |
|---|---|---|---|---|---|---|---|
| Standard | 7.46 | 8.63 | 9.63 | 10.80 | 11.80 | 12.97 | 13.97 |
| Camarilla | 10.03 | 10.23 | 10.43 | 10.63 | 10.83 | 11.03 | 11.23 |
| Woodie | 7.38 | 8.59 | 9.55 | 10.76 | 11.72 | 12.93 | 13.89 |
| Fibonacci | 8.63 | 9.46 | 9.97 | 10.80 | 11.63 | 12.14 | 12.97 |
Numerical data
The following is the status of technical indicators and moving averages registered at the time this technical analysis was created:
| RSI (14): | 45.88 | |
| MACD (12,26,9): | -0.1300 | |
| Directional Movement: | 3.46 | |
| AROON (14): | 21.43 | |
| DEMA (21): | 10.29 | |
| Parabolic SAR (0,02-0,02-0,2): | 11.93 | |
| Elder Ray (13): | -0.28 | |
| Super Trend (3,10): | 11.61 | |
| Zig ZAG (10): | 10.27 | |
| VORTEX (21): | 0.9700 | |
| Stochastique (14,3,5): | 17.67 | |
| TEMA (21): | 10.27 | |
| Williams %R (14): | -78.34 | |
| Chande Momentum Oscillator (20): | -0.45 | |
| Repulse (5,40,3): | -0.9000 | |
| ROCnROLL: | 2 | |
| TRIX (15,9): | -0.1300 | |
| Courbe Coppock: | 4.65 |
| MA7: | 10.34 | |
| MA20: | 10.47 | |
| MA50: | 10.71 | |
| MA100: | 11.29 | |
| MAexp7: | 10.30 | |
| MAexp20: | 10.45 | |
| MAexp50: | 10.72 | |
| MAexp100: | 11.30 | |
| Price / MA7: | -0.68% | |
| Price / MA20: | -1.91% | |
| Price / MA50: | -4.11% | |
| Price / MA100: | -9.03% | |
| Price / MAexp7: | -0.29% | |
| Price / MAexp20: | -1.72% | |
| Price / MAexp50: | -4.20% | |
| Price / MAexp100: | -9.12% |
News
Don"t forget to follow the news on IRONWOOD PHARMACEUTICALS INC.. At the time of publication of this analysis, the latest news was as follows:
- Cyclerion, the Planned R&D Spin-off of Ironwood Pharmaceuticals, Secures Commitments of $175 Million in Private Offering
- Ironwood Pharmaceuticals to Present at SVB Leerink Global Healthcare Conference
- Ironwood Pharmaceuticals Provides Fourth Quarter and Full Year 2018 Investor Update
- Sarissa Capital Issues Statement On Ironwood Pharmaceuticals
- Investor Network: Ironwood Pharmaceuticals, Inc. to Host Earnings Call
About author

Online


Add a comment
Comments
0 comments on the analysis IRONWOOD PHARMACEUTICALS INC. - Daily