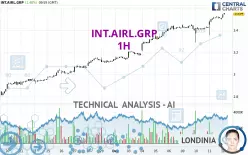
INT.AIRL.GRP - 1H - Technical analysis published on 12/12/2024 (GMT)
- 96
- 0
Click here for a new analysis!
- Timeframe : 1H
- - Analysis generated on
- Status : LEVEL MAINTAINED

Summary of the analysis

Additional analysis
Quotes
INT.AIRL.GRP rating 3.554 EUR. The price has increased by +1.49% since the last closing and was traded between 3.508 EUR and 3.554 EUR over the period. The price is currently at +1.31% from its lowest and 0% from its highest.A study of price movements over other periods shows the following variations:
New HIGH record (1 year)
Type : Bullish
Timeframe : Weekly
New HIGH record (1st january)
Type : Bullish
Timeframe : Weekly
New HIGH record (1 month)
Type : Bullish
Timeframe : Weekly
Technical
Technical analysis of this 1H chart of INT.AIRL.GRP indicates that the overall trend is strongly bullish. The signals given by the moving averages are 92.86% bullish. This strong bullish trend is confirmed by the strong signals currently being given by short-term moving averages. An assessment of moving averages reveals a bullish signal that could impact this trend:
Moving Average bullish crossovers : AMA20 & AMA50
Type : Bullish
Timeframe : 1 hour
The probability of a further increase is high given the direction of the technical indicators.
Caution: the Central Indicators scanner currently detects an excess:
RSI indicator is overbought : over 70
Type : Neutral
Timeframe : 1 hour
CCI indicator is overbought : over 100
Type : Neutral
Timeframe : 1 hour
Williams %R indicator is overbought : over -20
Type : Neutral
Timeframe : 1 hour
Pivot points : price is over resistance 1
Type : Neutral
Timeframe : Weekly
Central Patterns, the scanner specializing in chart patterns, did not identify any signals.
The Central Candlesticks scanner, specialised in Japanese candlesticks, did not identify any signals.
| S3 | S2 | S1 | Price | R1 | R2 | R3 | |
|---|---|---|---|---|---|---|---|
| ProTrendLines | 3.050 | 3.154 | 3.455 | 3.554 | 3.601 | 4.483 | 5.179 |
| Change (%) | -14.18% | -11.25% | -2.79% | - | +1.32% | +26.14% | +45.72% |
| Change | -0.504 | -0.400 | -0.099 | - | +0.047 | +0.929 | +1.625 |
| Level | Minor | Minor | Intermediate | - | Minor | Intermediate | Major |
Attention could also be paid to pivot points to set price objectives:
| Pivot points | S3 | S2 | S1 | PP | R1 | R2 | R3 |
|---|---|---|---|---|---|---|---|
| Standard | 3.222 | 3.287 | 3.395 | 3.460 | 3.568 | 3.633 | 3.741 |
| Camarilla | 3.454 | 3.470 | 3.486 | 3.502 | 3.518 | 3.534 | 3.550 |
| Woodie | 3.243 | 3.298 | 3.416 | 3.471 | 3.589 | 3.644 | 3.762 |
| Fibonacci | 3.287 | 3.353 | 3.394 | 3.460 | 3.526 | 3.567 | 3.633 |
| Pivot points | S3 | S2 | S1 | PP | R1 | R2 | R3 |
|---|---|---|---|---|---|---|---|
| Standard | 2.903 | 3.015 | 3.216 | 3.328 | 3.529 | 3.641 | 3.842 |
| Camarilla | 3.331 | 3.360 | 3.388 | 3.417 | 3.446 | 3.474 | 3.503 |
| Woodie | 2.948 | 3.037 | 3.261 | 3.350 | 3.574 | 3.663 | 3.887 |
| Fibonacci | 3.015 | 3.135 | 3.208 | 3.328 | 3.448 | 3.521 | 3.641 |
| Pivot points | S3 | S2 | S1 | PP | R1 | R2 | R3 |
|---|---|---|---|---|---|---|---|
| Standard | 1.988 | 2.224 | 2.680 | 2.916 | 3.372 | 3.608 | 4.064 |
| Camarilla | 2.945 | 3.008 | 3.072 | 3.135 | 3.198 | 3.262 | 3.325 |
| Woodie | 2.097 | 2.279 | 2.789 | 2.971 | 3.481 | 3.663 | 4.173 |
| Fibonacci | 2.224 | 2.489 | 2.652 | 2.916 | 3.181 | 3.344 | 3.608 |
Numerical data
The following is the status of technical indicators and moving averages registered at the time this technical analysis was created:
| RSI (14): | 77.21 | |
| MACD (12,26,9): | 0.0360 | |
| Directional Movement: | 1.995 | |
| AROON (14): | 71.429 | |
| DEMA (21): | 3.528 | |
| Parabolic SAR (0,02-0,02-0,2): | 3.490 | |
| Elder Ray (13): | 0.048 | |
| Super Trend (3,10): | 3.477 | |
| Zig ZAG (10): | 3.545 | |
| VORTEX (21): | 1.2100 | |
| Stochastique (14,3,5): | 93.86 | |
| TEMA (21): | 3.534 | |
| Williams %R (14): | -3.98 | |
| Chande Momentum Oscillator (20): | 0.120 | |
| Repulse (5,40,3): | 0.6380 | |
| ROCnROLL: | 1 | |
| TRIX (15,9): | 0.1250 | |
| Courbe Coppock: | 6.27 |
| MA7: | 3.430 | |
| MA20: | 3.162 | |
| MA50: | 2.798 | |
| MA100: | 2.478 | |
| MAexp7: | 3.519 | |
| MAexp20: | 3.482 | |
| MAexp50: | 3.411 | |
| MAexp100: | 3.301 | |
| Price / MA7: | +3.62% | |
| Price / MA20: | +12.40% | |
| Price / MA50: | +27.02% | |
| Price / MA100: | +43.42% | |
| Price / MAexp7: | +0.99% | |
| Price / MAexp20: | +2.07% | |
| Price / MAexp50: | +4.19% | |
| Price / MAexp100: | +7.66% |
News
The last news published on INT.AIRL.GRP at the time of the generation of this analysis was as follows:
- KWE and IAG Cargo Agree to Expand Use of Sustainable Aviation Fuel
-
 10/05/24 - UK GDP, recession fears put to rest, FTSE highs, IAG Reports
- Sabre and IAG expand partnership with multi-year distribution agreement including NDC content
- BigCommerce Powers New IAG Loyalty Online Wine Store in Partnership with British Airways
-
Why Are IAG Shares Cheap?
About author
Online


Add a comment
Comments
0 comments on the analysis INT.AIRL.GRP - 1H