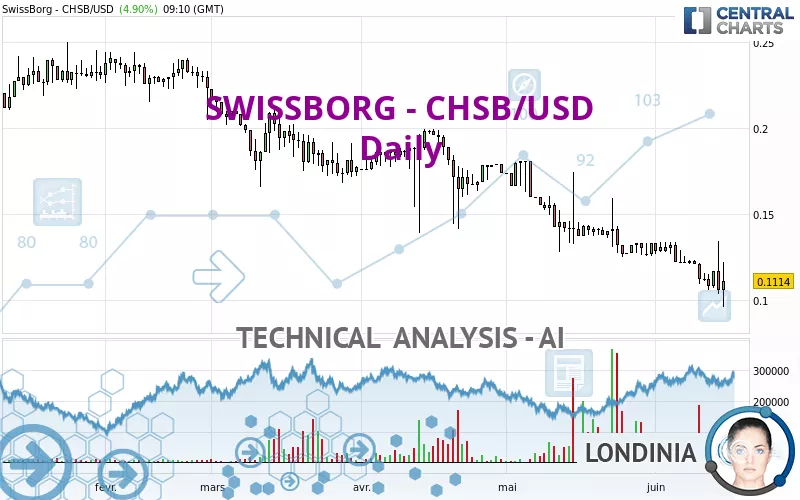
SWISSBORG - CHSB/USD - Daily - Technical analysis published on 06/15/2023 (GMT)
- 131
- 0
Click here for a new analysis!
- Timeframe : Daily
- - Analysis generated on
- Status : INVALID
Summary of the analysis
Additional analysis
Quotes
SWISSBORG - CHSB/USD rating 0.111400 USD. On the day, this instrument gained +4.90% with the lowest point at 0.096120 USD and the highest point at 0.122000 USD. The deviation from the price is +15.90% for the low point and -8.69% for the high point.A study of price movements over other periods shows the following variations:
New LOW record (1 year)
Type : Bearish
Timeframe : Weekly
New LOW record (1st january)
Type : Bearish
Timeframe : Weekly
New LOW record (1 month)
Type : Bearish
Timeframe : Weekly
The Central Volumes scanner detects abnormal volumes on the asset:
Abnormal volumes
Timeframe : 50 days
Technical
A technical analysis in Daily of this SWISSBORG - CHSB/USD chart shows a sharp bearish trend. The signals given by moving averages are 92.86% bearish. This strong bearish trend is confirmed by the strong signals currently being given by short-term moving averages. There is no crossing of moving average by the price or crossing of moving averages between themselves.
An assessment of technical indicators does not currently provide any relevant information to suggest whether the signal given by the technical indicators is more bullish or bearish.
Caution: the Central Indicators scanner currently detects an excess:
CCI indicator is oversold : under -100
Type : Neutral
Timeframe : Daily
MACD indicator: bullish divergence
Type : Bullish
Timeframe : Daily
RSI indicator: bullish divergence
Type : Bullish
Timeframe : Daily
Parabolic SAR indicator bearish reversal
Type : Bearish
Timeframe : Daily
Central Patterns, the scanner specializing in chart patterns, did not identify any signals.
For a small rebound in the very short term, the Central Candlesticks scanner currently notes the presence of this bullish pattern in Japanese candlesticks:
Long white line
Type : Bullish
Timeframe : Daily
| Price | R1 | R2 | R3 | |
|---|---|---|---|---|
| ProTrendLines | 0.111400 | 0.126922 | 0.180907 | 0.198400 |
| Change (%) | - | +13.93% | +62.39% | +78.10% |
| Change | - | +0.015522 | +0.069507 | +0.087000 |
| Level | - | Minor | Intermediate | Minor |
Pivot points can also be used to set your price objectives. Here is the price situation in relation to pivot points:
| Pivot points | S3 | S2 | S1 | PP | R1 | R2 | R3 |
|---|---|---|---|---|---|---|---|
| Standard | 0.064067 | 0.083733 | 0.094967 | 0.114633 | 0.125867 | 0.145533 | 0.156767 |
| Camarilla | 0.097703 | 0.100535 | 0.103368 | 0.106200 | 0.109033 | 0.111865 | 0.114698 |
| Woodie | 0.059850 | 0.081625 | 0.090750 | 0.112525 | 0.121650 | 0.143425 | 0.152550 |
| Fibonacci | 0.083733 | 0.095537 | 0.102830 | 0.114633 | 0.126437 | 0.133730 | 0.145533 |
| Pivot points | S3 | S2 | S1 | PP | R1 | R2 | R3 |
|---|---|---|---|---|---|---|---|
| Standard | 0.079433 | 0.094567 | 0.103433 | 0.118567 | 0.127433 | 0.142567 | 0.151433 |
| Camarilla | 0.105700 | 0.107900 | 0.110100 | 0.112300 | 0.114500 | 0.116700 | 0.118900 |
| Woodie | 0.076300 | 0.093000 | 0.100300 | 0.117000 | 0.124300 | 0.141000 | 0.148300 |
| Fibonacci | 0.094567 | 0.103735 | 0.109399 | 0.118567 | 0.127735 | 0.133399 | 0.142567 |
| Pivot points | S3 | S2 | S1 | PP | R1 | R2 | R3 |
|---|---|---|---|---|---|---|---|
| Standard | 0.056867 | 0.091133 | 0.112267 | 0.146533 | 0.167667 | 0.201933 | 0.223067 |
| Camarilla | 0.118165 | 0.123243 | 0.128322 | 0.133400 | 0.138478 | 0.143557 | 0.148635 |
| Woodie | 0.050300 | 0.087850 | 0.105700 | 0.143250 | 0.161100 | 0.198650 | 0.216500 |
| Fibonacci | 0.091133 | 0.112296 | 0.125371 | 0.146533 | 0.167696 | 0.180771 | 0.201933 |
Numerical data
The following is the status of technical indicators and moving averages registered at the time this technical analysis was created:
| RSI (14): | 35.93 | |
| MACD (12,26,9): | -0.0087 | |
| Directional Movement: | -1.940617 | |
| AROON (14): | -7.142857 | |
| DEMA (21): | 0.109896 | |
| Parabolic SAR (0,02-0,02-0,2): | 0.134300 | |
| Elder Ray (13): | -0.008052 | |
| Super Trend (3,10): | 0.132300 | |
| Zig ZAG (10): | 0.110200 | |
| VORTEX (21): | 0.8328 | |
| Stochastique (14,3,5): | 29.60 | |
| TEMA (21): | 0.109603 | |
| Williams %R (14): | -59.46 | |
| Chande Momentum Oscillator (20): | -0.016800 | |
| Repulse (5,40,3): | -7.7494 | |
| ROCnROLL: | 2 | |
| TRIX (15,9): | -0.8600 | |
| Courbe Coppock: | 26.56 |
| MA7: | 0.112614 | |
| MA20: | 0.122590 | |
| MA50: | 0.141040 | |
| MA100: | 0.163008 | |
| MAexp7: | 0.113210 | |
| MAexp20: | 0.121544 | |
| MAexp50: | 0.138398 | |
| MAexp100: | 0.158464 | |
| Price / MA7: | -1.08% | |
| Price / MA20: | -9.13% | |
| Price / MA50: | -21.02% | |
| Price / MA100: | -31.66% | |
| Price / MAexp7: | -1.60% | |
| Price / MAexp20: | -8.35% | |
| Price / MAexp50: | -19.51% | |
| Price / MAexp100: | -29.70% |
About author

Online


Add a comment
Comments
0 comments on the analysis SWISSBORG - CHSB/USD - Daily