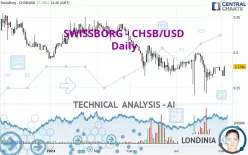
SWISSBORG - CHSB/USD - Daily - Technical analysis published on 05/03/2023 (GMT)
- 155
- 0
Click here for a new analysis!
- Timeframe : Daily
- - Analysis generated on
- Status : TARGET REACHED

Summary of the analysis
Additional analysis
Quotes
The SWISSBORG - CHSB/USD price is 0.179600 USD. On the day, this instrument gained +7.74% and was between 0.166700 USD and 0.180400 USD. This implies that the price is at +7.74% from its lowest and at -0.44% from its highest.Here is a more detailed summary of the historical variations registered by SWISSBORG - CHSB/USD:
Abnormal volumes
Timeframe : 50 days
Technical
A technical analysis in Daily of this SWISSBORG - CHSB/USD chart shows a bearish trend. 75.00% of the signals given by moving averages are bearish. Caution: as the signals currently given by short-term moving averages are rather neutral, the bearish trend could slow down. The Central Indicators market scanner currently does not detect any result that concerns moving averages.
The probability of a further increase is slight given the direction of the technical indicators.
But beware of excesses. The Central Indicators scanner currently detects this:
MACD indicator: bullish divergence
Type : Bullish
Timeframe : Daily
RSI indicator: bullish divergence
Type : Bullish
Timeframe : Daily
Williams %R indicator is overbought : over -20
Type : Neutral
Timeframe : Daily
Pivot points : price is over resistance 3
Type : Neutral
Timeframe : Daily
RSI indicator is back over 50
Type : Bullish
Timeframe : Daily
MACD crosses UP its Moving Average
Type : Bullish
Timeframe : Daily
Parabolic SAR indicator bullish reversal
Type : Bullish
Timeframe : Daily
Momentum indicator is back over 0
Type : Bullish
Timeframe : Daily
The analysis of the price chart with Central Patterns scanners does not return any result.
The Central Candlesticks scanner, specialised in Japanese candlesticks, did not identify any signals.
| S1 | Price | R1 | R2 | R3 | |
|---|---|---|---|---|---|
| ProTrendLines | 0.164800 | 0.179600 | 0.181114 | 0.198489 | 0.240389 |
| Change (%) | -8.24% | - | +0.84% | +10.52% | +33.85% |
| Change | -0.014800 | - | +0.001514 | +0.018889 | +0.060789 |
| Level | Intermediate | - | Minor | Minor | Major |
To determine price objectives, it is also possible to use the pivot points. Here is the price position in relation to pivot points:
| Pivot points | S3 | S2 | S1 | PP | R1 | R2 | R3 |
|---|---|---|---|---|---|---|---|
| Standard | 0.156567 | 0.161633 | 0.164167 | 0.169233 | 0.171767 | 0.176833 | 0.179367 |
| Camarilla | 0.164610 | 0.165307 | 0.166003 | 0.166700 | 0.167397 | 0.168093 | 0.168790 |
| Woodie | 0.155300 | 0.161000 | 0.162900 | 0.168600 | 0.170500 | 0.176200 | 0.178100 |
| Fibonacci | 0.161633 | 0.164537 | 0.166330 | 0.169233 | 0.172137 | 0.173930 | 0.176833 |
| Pivot points | S3 | S2 | S1 | PP | R1 | R2 | R3 |
|---|---|---|---|---|---|---|---|
| Standard | 0.149433 | 0.155367 | 0.167233 | 0.173167 | 0.185033 | 0.190967 | 0.202833 |
| Camarilla | 0.174205 | 0.175837 | 0.177468 | 0.179100 | 0.180732 | 0.182363 | 0.183995 |
| Woodie | 0.152400 | 0.156850 | 0.170200 | 0.174650 | 0.188000 | 0.192450 | 0.205800 |
| Fibonacci | 0.155367 | 0.162166 | 0.166367 | 0.173167 | 0.179966 | 0.184167 | 0.190967 |
| Pivot points | S3 | S2 | S1 | PP | R1 | R2 | R3 |
|---|---|---|---|---|---|---|---|
| Standard | 0.082233 | 0.110767 | 0.142533 | 0.171067 | 0.202833 | 0.231367 | 0.263133 |
| Camarilla | 0.157718 | 0.163245 | 0.168773 | 0.174300 | 0.179828 | 0.185355 | 0.190883 |
| Woodie | 0.083850 | 0.111575 | 0.144150 | 0.171875 | 0.204450 | 0.232175 | 0.264750 |
| Fibonacci | 0.110767 | 0.133801 | 0.148032 | 0.171067 | 0.194101 | 0.208332 | 0.231367 |
Numerical data
The following are the details of the technical indicators and moving averages that were collected to generate this technical analysis:
| RSI (14): | 50.43 | |
| MACD (12,26,9): | -0.0032 | |
| Directional Movement: | -19.084893 | |
| AROON (14): | -14.285714 | |
| DEMA (21): | 0.171514 | |
| Parabolic SAR (0,02-0,02-0,2): | 0.141500 | |
| Elder Ray (13): | -0.001039 | |
| Super Trend (3,10): | 0.199104 | |
| Zig ZAG (10): | 0.170400 | |
| VORTEX (21): | 1.0442 | |
| Stochastique (14,3,5): | 59.90 | |
| TEMA (21): | 0.171079 | |
| Williams %R (14): | -11.81 | |
| Chande Momentum Oscillator (20): | 0.014800 | |
| Repulse (5,40,3): | 4.9773 | |
| ROCnROLL: | -1 | |
| TRIX (15,9): | -0.2605 | |
| Courbe Coppock: | 10.94 |
| MA7: | 0.175771 | |
| MA20: | 0.178530 | |
| MA50: | 0.182336 | |
| MA100: | 0.203077 | |
| MAexp7: | 0.174928 | |
| MAexp20: | 0.177479 | |
| MAexp50: | 0.185012 | |
| MAexp100: | 0.194310 | |
| Price / MA7: | +2.18% | |
| Price / MA20: | +0.60% | |
| Price / MA50: | -1.50% | |
| Price / MA100: | -11.56% | |
| Price / MAexp7: | +2.67% | |
| Price / MAexp20: | +1.20% | |
| Price / MAexp50: | -2.93% | |
| Price / MAexp100: | -7.57% |
About author

Online


Add a comment
Comments
0 comments on the analysis SWISSBORG - CHSB/USD - Daily