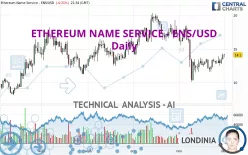
ETHEREUM NAME SERVICE - ENS/USD - Daily - Technical analysis published on 12/01/2022 (GMT)
- 145
- 0
- Timeframe : Daily
- - Analysis generated on
- Status : NEUTRAL

Summary of the analysis

Additional analysis
Quotes
ETHEREUM NAME SERVICE - ENS/USD rating 14.10 USD. The price registered a decrease of -0.21% on the session and was traded between 13.76 USD and 14.25 USD over the period. The price is currently at +2.47% from its lowest and -1.05% from its highest.A bullish opening was detected by the Central Gaps scanner. Buyers are trying to impose a bullish momentum in the very short term.
Bullish opening
Type : Bullish
Timeframe : Openning
A study of price movements over other periods shows the following variations:
Technical
Technical analysis of this Daily chart of ETHEREUM NAME SERVICE - ENS/USD indicates that the overall trend is slightly bearish. Only 57.14% of the signals given by moving averages are bearish. This slightly bearish trend could return to neutral given the neutral signals also given by short-term moving averages. The Central Indicators scanner detects a bearish signal on moving averages that could impact this trend:
Bearish price crossover with adaptative moving average 20
Type : Bearish
Timeframe : Daily
The technical indicators are bullish. There is still some doubt about the price increase.
Caution: the Central Indicators scanner currently detects an excess:
CCI indicator is overbought : over 100
Type : Neutral
Timeframe : Daily
Previous candle closed over Bollinger bands
Type : Neutral
Timeframe : Daily
Williams %R indicator is overbought : over -20
Type : Neutral
Timeframe : Daily
Pivot points : price is over resistance 1
Type : Neutral
Timeframe : Weekly
An analysis of the price chart with the Central Patterns scanner (detector of chart patterns and resistances and supports) shows a result that can have an impact on the price change:
Resistance of channel is broken
Type : Bullish
Timeframe : Daily
No result was found by the Central Candlesticks scanner on Japanese candlesticks.
| S3 | S2 | S1 | Price | R1 | R2 | R3 | |
|---|---|---|---|---|---|---|---|
| ProTrendLines | 10.42 | 11.99 | 13.40 | 14.10 | 15.71 | 17.22 | 19.82 |
| Change (%) | -26.10% | -14.96% | -4.96% | - | +11.42% | +22.13% | +40.57% |
| Change | -3.68 | -2.11 | -0.70 | - | +1.61 | +3.12 | +5.72 |
| Level | Minor | Minor | Intermediate | - | Minor | Intermediate | Intermediate |
Pivot points can also be used to set your price objectives. Here is the price situation in relation to pivot points:
| Pivot points | S3 | S2 | S1 | PP | R1 | R2 | R3 |
|---|---|---|---|---|---|---|---|
| Standard | 12.69 | 13.06 | 13.60 | 13.97 | 14.51 | 14.88 | 15.42 |
| Camarilla | 13.88 | 13.96 | 14.05 | 14.13 | 14.21 | 14.30 | 14.38 |
| Woodie | 12.77 | 13.10 | 13.68 | 14.01 | 14.59 | 14.92 | 15.50 |
| Fibonacci | 13.06 | 13.41 | 13.63 | 13.97 | 14.32 | 14.54 | 14.88 |
| Pivot points | S3 | S2 | S1 | PP | R1 | R2 | R3 |
|---|---|---|---|---|---|---|---|
| Standard | 9.85 | 10.70 | 11.83 | 12.68 | 13.81 | 14.66 | 15.79 |
| Camarilla | 12.41 | 12.59 | 12.77 | 12.95 | 13.13 | 13.31 | 13.50 |
| Woodie | 9.98 | 10.77 | 11.96 | 12.75 | 13.94 | 14.73 | 15.92 |
| Fibonacci | 10.70 | 11.46 | 11.93 | 12.68 | 13.44 | 13.91 | 14.66 |
| Pivot points | S3 | S2 | S1 | PP | R1 | R2 | R3 |
|---|---|---|---|---|---|---|---|
| Standard | 1.61 | 5.86 | 9.99 | 14.24 | 18.37 | 22.62 | 26.75 |
| Camarilla | 11.83 | 12.59 | 13.36 | 14.13 | 14.90 | 15.67 | 16.44 |
| Woodie | 1.56 | 5.83 | 9.94 | 14.21 | 18.32 | 22.59 | 26.70 |
| Fibonacci | 5.86 | 9.06 | 11.04 | 14.24 | 17.44 | 19.42 | 22.62 |
Numerical data
The following are the details of the technical indicators and moving averages that were collected to generate this technical analysis:
| RSI (14): | 51.79 | |
| MACD (12,26,9): | -0.3400 | |
| Directional Movement: | 1.21 | |
| AROON (14): | 64.29 | |
| DEMA (21): | 12.85 | |
| Parabolic SAR (0,02-0,02-0,2): | 11.20 | |
| Elder Ray (13): | 0.65 | |
| Super Trend (3,10): | 15.69 | |
| Zig ZAG (10): | 13.99 | |
| VORTEX (21): | 1.1800 | |
| Stochastique (14,3,5): | 86.25 | |
| TEMA (21): | 13.16 | |
| Williams %R (14): | -13.62 | |
| Chande Momentum Oscillator (20): | 0.56 | |
| Repulse (5,40,3): | 3.7800 | |
| ROCnROLL: | -1 | |
| TRIX (15,9): | -0.7200 | |
| Courbe Coppock: | 11.95 |
| MA7: | 13.38 | |
| MA20: | 12.96 | |
| MA50: | 15.38 | |
| MA100: | 15.03 | |
| MAexp7: | 13.51 | |
| MAexp20: | 13.49 | |
| MAexp50: | 14.37 | |
| MAexp100: | 14.65 | |
| Price / MA7: | +5.38% | |
| Price / MA20: | +8.80% | |
| Price / MA50: | -8.32% | |
| Price / MA100: | -6.19% | |
| Price / MAexp7: | +4.37% | |
| Price / MAexp20: | +4.52% | |
| Price / MAexp50: | -1.88% | |
| Price / MAexp100: | -3.75% |
About author
Online


Add a comment
Comments
0 comments on the analysis ETHEREUM NAME SERVICE - ENS/USD - Daily