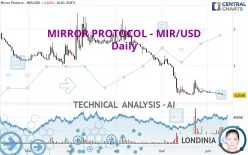
MIRROR PROTOCOL - MIR/USD - Daily - Technical analysis published on 06/12/2022 (GMT)
- 291
- 0
- Timeframe : Daily
- - Analysis generated on
- Status : WITHOUT TARGET

Summary of the analysis

Additional analysis
Quotes
MIRROR PROTOCOL - MIR/USD rating 0.203600 USD. The price is lower by -4.64% since the last closing with the lowest point at 0.202400 USD and the highest point at 0.218300 USD. The deviation from the price is +0.59% for the low point and -6.73% for the high point.A bullish opening was detected by the Central Gaps scanner. Buyers are trying to impose a bullish momentum in the very short term.
Bullish opening
Type : Bullish
Timeframe : Openning
A study of price movements over other periods shows the following variations:
Near a new LOW record (1st january)
Type : Bearish
Timeframe : Weekly
Near a new LOW record (1 month)
Type : Bearish
Timeframe : Weekly
The Central Volumes scanner detects abnormal volumes on the asset:
Abnormal volumes
Timeframe : 5 days
Abnormal volumes
Timeframe : 20 days
Abnormal volumes
Timeframe : 50 days
Technical
A technical analysis in Daily of this MIRROR PROTOCOL - MIR/USD chart shows a sharp bearish trend. 92.86% of the signals given by moving averages are bearish. The overall trend is supported by the strong bearish signals from short-term moving averages. The Central Indicators scanner detects a bearish signal on moving averages that could impact this trend:
Bearish trend reversal : Moving Average 20
Type : Bearish
Timeframe : Daily
An assessment of technical indicators does not currently provide any relevant information on the direction of future price movements.
Caution: the Central Indicators scanner currently detects an excess:
CCI indicator is oversold : under -100
Type : Neutral
Timeframe : Daily
Williams %R indicator is oversold : under -80
Type : Neutral
Timeframe : Daily
Pivot points : price is under support 1
Type : Neutral
Timeframe : Daily
Pivot points : price is under support 1
Type : Neutral
Timeframe : Weekly
Central Patterns, the scanner specializing in chart patterns, did not identify any signals.
The Central Candlesticks scanner which studies Japanese candlesticks did not detect anything.
| Price | R1 | R2 | R3 | |
|---|---|---|---|---|
| ProTrendLines | 0.203600 | 0.213000 | 0.521000 | 1.613860 |
| Change (%) | - | +4.62% | +155.89% | +692.66% |
| Change | - | +0.009400 | +0.317400 | +1.410260 |
| Level | - | Intermediate | Minor | Intermediate |
Pivot points can also be used to set your price objectives. Here is the price situation in relation to pivot points:
| Pivot points | S3 | S2 | S1 | PP | R1 | R2 | R3 |
|---|---|---|---|---|---|---|---|
| Standard | 0.146200 | 0.174100 | 0.193800 | 0.221700 | 0.241400 | 0.269300 | 0.289000 |
| Camarilla | 0.200410 | 0.204773 | 0.209137 | 0.213500 | 0.217863 | 0.222227 | 0.226590 |
| Woodie | 0.142100 | 0.172050 | 0.189700 | 0.219650 | 0.237300 | 0.267250 | 0.284900 |
| Fibonacci | 0.174100 | 0.192283 | 0.203517 | 0.221700 | 0.239883 | 0.251117 | 0.269300 |
| Pivot points | S3 | S2 | S1 | PP | R1 | R2 | R3 |
|---|---|---|---|---|---|---|---|
| Standard | 0.103400 | 0.152700 | 0.183100 | 0.232400 | 0.262800 | 0.312100 | 0.342500 |
| Camarilla | 0.191583 | 0.198888 | 0.206194 | 0.213500 | 0.220806 | 0.228112 | 0.235418 |
| Woodie | 0.093950 | 0.147975 | 0.173650 | 0.227675 | 0.253350 | 0.307375 | 0.333050 |
| Fibonacci | 0.152700 | 0.183145 | 0.201955 | 0.232400 | 0.262845 | 0.281655 | 0.312100 |
| Pivot points | S3 | S2 | S1 | PP | R1 | R2 | R3 |
|---|---|---|---|---|---|---|---|
| Standard | -1.162833 | -0.480867 | -0.094933 | 0.587033 | 0.972967 | 1.654933 | 2.040867 |
| Camarilla | -0.002673 | 0.095218 | 0.193109 | 0.291000 | 0.388891 | 0.486782 | 0.584673 |
| Woodie | -1.310850 | -0.554875 | -0.242950 | 0.513025 | 0.824950 | 1.580925 | 1.892850 |
| Fibonacci | -0.480867 | -0.072929 | 0.179096 | 0.587033 | 0.994971 | 1.246996 | 1.654933 |
Numerical data
The following are the details of the technical indicators and moving averages that were collected to generate this technical analysis:
| RSI (14): | 31.98 | |
| MACD (12,26,9): | -0.0878 | |
| Directional Movement: | -4.080578 | |
| AROON (14): | -85.714286 | |
| DEMA (21): | 0.157051 | |
| Parabolic SAR (0,02-0,02-0,2): | 0.451454 | |
| Elder Ray (13): | -0.043308 | |
| Super Trend (3,10): | 0.364769 | |
| Zig ZAG (10): | 0.205700 | |
| VORTEX (21): | 0.9942 | |
| Stochastique (14,3,5): | 3.33 | |
| TEMA (21): | 0.223381 | |
| Williams %R (14): | -97.74 | |
| Chande Momentum Oscillator (20): | -0.085500 | |
| Repulse (5,40,3): | -25.1219 | |
| ROCnROLL: | 2 | |
| TRIX (15,9): | -3.2991 | |
| Courbe Coppock: | 49.59 |
| MA7: | 0.233443 | |
| MA20: | 0.279130 | |
| MA50: | 0.551424 | |
| MA100: | 1.115142 | |
| MAexp7: | 0.231227 | |
| MAexp20: | 0.291678 | |
| MAexp50: | 0.556720 | |
| MAexp100: | 0.890611 | |
| Price / MA7: | -12.78% | |
| Price / MA20: | -27.06% | |
| Price / MA50: | -63.08% | |
| Price / MA100: | -81.74% | |
| Price / MAexp7: | -11.95% | |
| Price / MAexp20: | -30.20% | |
| Price / MAexp50: | -63.43% | |
| Price / MAexp100: | -77.14% |
About author

Online


Add a comment
Comments
0 comments on the analysis MIRROR PROTOCOL - MIR/USD - Daily