RAYDIUM - RAY/USD overview
RAYDIUM - RAY/USD
> Analyses

 Thank you
Reply
Chart
Thank you
Reply
Chart
Londinia
has published a new analysis.
- 0
- 94151
- 15809
- 0
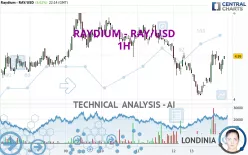
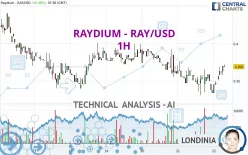
Timeframe : 1H - Simple chart
Status : NEUTRAL
The short-term increase on RAYDIUM - RAY/USD remains moderate but could challenge the slightly bearish basic trend. It is difficult to advise a trading direction under these conditions. The first…
RAYDIUM - RAY/USD
> Analyses
 Thank you
Reply
Chart
Thank you
Reply
Chart
Londinia
has published a new analysis.
- 0
- 94151
- 15809
- 0
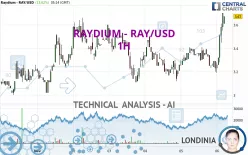
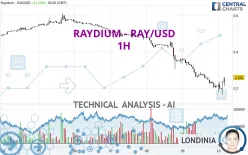
Timeframe : 1H - Simple chart
Status : INVALID
The current short-term bullish trend should quickly fix the basic bullish trend. To avoid contradicting the short term, it would be possible to favour long positions (at the time of purchase) for…
RAYDIUM - RAY/USD
> Analyses
 Thank you
Reply
Chart
Thank you
Reply
Chart
Londinia
has published a new analysis.
- 0
- 94151
- 15809
- 0
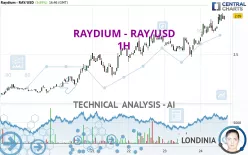
Timeframe : 1H - Simple chart
Status : TARGET REACHED
All elements being clearly bullish, it would be possible for traders to trade only long positions (at the time of purchase) on RAYDIUM - RAY/USD as long as the price remains well above 3.52 USD. The…
RAYDIUM - RAY/USD
> Analyses
 Thank you
Reply
Chart
Thank you
Reply
Chart
Londinia
has published a new analysis.
- 0
- 94151
- 15809
- 0
Timeframe : 1H - Simple chart
Status : LEVEL MAINTAINED
All elements being clearly bullish, it would be possible for traders to trade only long positions (at the time of purchase) on RAYDIUM - RAY/USD as long as the price remains well above 2.78 USD. The…
RAYDIUM - RAY/USD
> Analyses
 Thank you
Reply
Chart
Thank you
Reply
Chart
Londinia
has published a new analysis.
- 0
- 94151
- 15809
- 0
Timeframe : 1H - Simple chart
Status : TARGET REACHED
The bullish trend is currently very strong on RAYDIUM - RAY/USD. As long as the price remains above the support at 2.19 USD, you could try to benefit from the boom. The first bullish objective is…
RAYDIUM - RAY/USD
> Analyses
 Thank you
Reply
Chart
Thank you
Reply
Chart
Londinia
has published a new analysis.
- 0
- 94151
- 15809
- 0
Timeframe : 1H - Simple chart
Status : LEVEL MAINTAINED
We are currently in a phase of short-term indecision. In a case like this, you could favour trades in the direction of the basic trend on RAYDIUM - RAY/USD. As long as you are under the resistance…
RAYDIUM - RAY/USD
> Analyses
 Thank you
Reply
Chart
Thank you
Reply
Chart
Londinia
has published a new analysis.
- 0
- 94151
- 15809
- 0
Timeframe : 1H - Simple chart
Status : TARGET REACHED
The strong short-term increase for RAYDIUM - RAY/USD reinforces the current slightly bullish trend. As long as the price remains above 0.365889 USD, you could take advantage of this bullish…
RAYDIUM - RAY/USD
> Analyses
 Thank you
Reply
Chart
Thank you
Reply
Chart
Londinia
has published a new analysis.
- 0
- 94151
- 15809
- 0
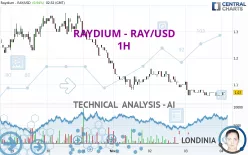
Timeframe : 1H - Simple chart
Status : WITHOUT TARGET
Has the basic bearish trend slowed or is it lacking in power? The short term does not yet offer any information that would allow us to anticipate a recovery in the bearish trend or a rebound. Sellers'…

