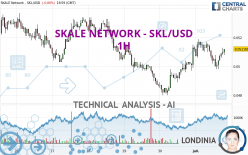
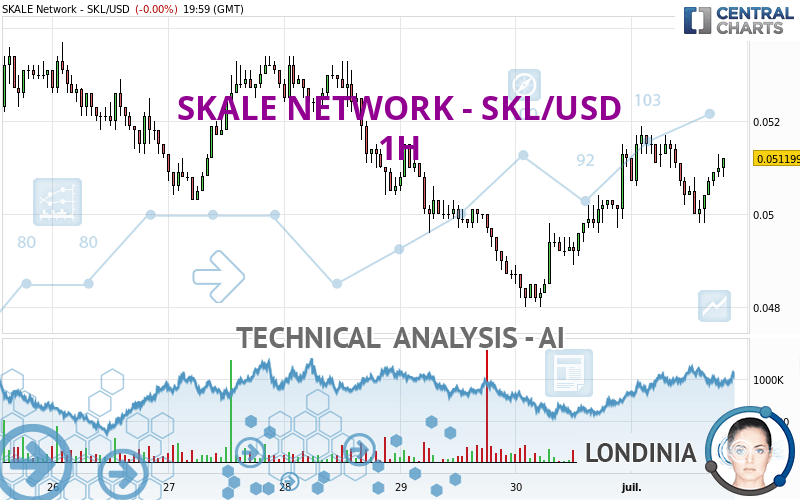
SKALE NETWORK - SKL/USD - 1H - Technical analysis published on 07/01/2024 (GMT)
- 102
- 0
Oops, I was wrong about that analysis. My threshold for invalidation has been broken.
Click here for a new analysis!
Click here for a new analysis!
- Timeframe : 1H
- - Analysis generated on
- Status : INVALID
Summary of the analysis
Trends
Short term:
Bullish
Underlying:
Bullish
Technical indicators
67%
11%
22%
My opinion
Bullish above 0.050294 USD
My targets
0.053340 USD (+4.18%)
0.054700 USD (+6.84%)
My analysis
A bullish trend on SKALE NETWORK - SKL/USD both in substance and in the short term. A purchase could be considered as long as the price remains above 0.050294 USD. Each resistance break is a strong signal that the current trend will continue. The first bullish objective would be 0.053340 USD. Then the price could move towards 0.054700 USD. Then 0.055502 USD by extension. Be careful, a return below 0.050294 USD would be a sign of the trend weakening and a possible correction phase could then occur. In this case, you could keep away while waiting for a signal that the basic trend will resume. Trading against the trend could be riskier.
Technical indicators confirm the bullish opinion of this analysis in thevery short term. However, be careful of excessive bullish movements. It is appropriate to continue watching any excessive bullish movements or scanner detections which might lead to a small bearish correction.
Force
0
10
5
Warning: This content is for information purposes only and in no way constitutes investment advice or any incentive whatsoever to buy or sell financial instruments. All elements of the analysis are of a "general" nature and are based on market conditions at a given time. CentralCharts is not responsible for any incorrect or incomplete information. Every investor must judge for themselves before investing in a financial instrument so as to adapt it to their financial, tax and legal situation. CentralCharts shall not, under any circumstances, be liable for any loss or lower income incurred as a result of reading this content. Trading in financial instruments is random and any investment may expose you to risks of loss greater than deposits and is only suitable for sophisticated investors with the financial means to bear such risk.

This analysis was given by Londinia. Take part yourself by sharing additional analysis on another time unit:
Additional analysis
Quotes
SKALE NETWORK - SKL/USD rating 0.051199 USD. On the day, this instrument gained +0.00% and was traded between 0.049800 USD and 0.051899 USD over the period. The price is currently at +2.81% from its lowest and -1.35% from its highest.0.049800
0.051899
0.051199
So that you have an overall view of the price change, here is a table showing the variations over several periods:
Near a new LOW record (1st january)
Type : Bearish
Timeframe : Weekly
Near a new LOW record (1 month)
Type : Bearish
Timeframe : Weekly
Technical
A technical analysis in 1H of this SKALE NETWORK - SKL/USD chart shows a bullish trend. 67.86% of the signals given by moving averages are bullish. This bullish trend shows slight signs of slowing down given the slightly bullish signals given by the short-term moving averages. An assessment of moving averages reveals several bearish signals that could impact this trend:
Bearish trend reversal : Moving Average 20
Type : Bearish
Timeframe : 1 hour
Bearish price crossover with adaptative moving average 20
Type : Bearish
Timeframe : 1 hour
In fact, according to the parameters integrated into the Central Analyzer system, 12 technical indicators out of 18 analysed are currently bullish. Central Indicators, the scanner specialised in technical indicators, has identified this signal:
Price is back over the pivot point
Type : Bullish
Timeframe : Weekly
No signals are given by Central Patterns, a market scanner specialised in chart patterns, resistances and supports.
Central Candlesticks, the scanner specialised in Japanese candlesticks, detects this inversion signal that could impact the current short-term trend:
Doji
Type : Neutral
Timeframe : 1 hour
ProTrendLines
S3
S2
S1
R1
R2
R3
Price
| S3 | S2 | S1 | Price | R1 | R2 | R3 | |
|---|---|---|---|---|---|---|---|
| ProTrendLines | 0.047904 | 0.048901 | 0.050294 | 0.051199 | 0.051399 | 0.053340 | 0.054700 |
| Change (%) | -6.44% | -4.49% | -1.77% | - | +0.39% | +4.18% | +6.84% |
| Change | -0.003295 | -0.002298 | -0.000905 | - | +0.000200 | +0.002141 | +0.003501 |
| Level | Intermediate | Minor | Intermediate | - | Intermediate | Major | Minor |
To determine price objectives, it is also possible to use the pivot points. Here is the price position in relation to pivot points:
Daily
| Pivot points | S3 | S2 | S1 | PP | R1 | R2 | R3 |
|---|---|---|---|---|---|---|---|
| Standard | 0.045467 | 0.046733 | 0.048967 | 0.050233 | 0.052467 | 0.053733 | 0.055967 |
| Camarilla | 0.050238 | 0.050558 | 0.050879 | 0.051200 | 0.051521 | 0.051842 | 0.052163 |
| Woodie | 0.045950 | 0.046975 | 0.049450 | 0.050475 | 0.052950 | 0.053975 | 0.056450 |
| Fibonacci | 0.046733 | 0.048070 | 0.048896 | 0.050233 | 0.051570 | 0.052396 | 0.053733 |
Weekly
| Pivot points | S3 | S2 | S1 | PP | R1 | R2 | R3 |
|---|---|---|---|---|---|---|---|
| Standard | 0.039374 | 0.043639 | 0.046170 | 0.050435 | 0.052966 | 0.057231 | 0.059762 |
| Camarilla | 0.046832 | 0.047455 | 0.048078 | 0.048701 | 0.049324 | 0.049947 | 0.050570 |
| Woodie | 0.038507 | 0.043206 | 0.045303 | 0.050002 | 0.052099 | 0.056798 | 0.058895 |
| Fibonacci | 0.043639 | 0.046235 | 0.047839 | 0.050435 | 0.053031 | 0.054635 | 0.057231 |
Monthly
| Pivot points | S3 | S2 | S1 | PP | R1 | R2 | R3 |
|---|---|---|---|---|---|---|---|
| Standard | 0.005439 | 0.026671 | 0.038936 | 0.060168 | 0.072433 | 0.093665 | 0.105930 |
| Camarilla | 0.041988 | 0.045059 | 0.048129 | 0.051200 | 0.054271 | 0.057341 | 0.060412 |
| Woodie | 0.000955 | 0.024429 | 0.034452 | 0.057926 | 0.067949 | 0.091423 | 0.101446 |
| Fibonacci | 0.026671 | 0.039467 | 0.047373 | 0.060168 | 0.072964 | 0.080870 | 0.093665 |
Numerical data
The following is the status of the technical indicators and moving averages at the time of publication of this technical analysis:
Technical indicators
Moving averages
| RSI (14): | 56.13 | |
| MACD (12,26,9): | 0.0001 | |
| Directional Movement: | 4.149753 | |
| AROON (14): | -50.000000 | |
| DEMA (21): | 0.050907 | |
| Parabolic SAR (0,02-0,02-0,2): | 0.049830 | |
| Elder Ray (13): | 0.000242 | |
| Super Trend (3,10): | 0.049936 | |
| Zig ZAG (10): | 0.051001 | |
| VORTEX (21): | 1.0962 | |
| Stochastique (14,3,5): | 61.37 | |
| TEMA (21): | 0.050851 | |
| Williams %R (14): | -36.93 | |
| Chande Momentum Oscillator (20): | -0.000501 | |
| Repulse (5,40,3): | 0.5454 | |
| ROCnROLL: | 1 | |
| TRIX (15,9): | 0.0553 | |
| Courbe Coppock: | 2.61 |
| MA7: | 0.051229 | |
| MA20: | 0.055590 | |
| MA50: | 0.068714 | |
| MA100: | 0.083129 | |
| MAexp7: | 0.050762 | |
| MAexp20: | 0.050706 | |
| MAexp50: | 0.050520 | |
| MAexp100: | 0.050750 | |
| Price / MA7: | -0.06% | |
| Price / MA20: | -7.90% | |
| Price / MA50: | -25.49% | |
| Price / MA100: | -38.41% | |
| Price / MAexp7: | +0.86% | |
| Price / MAexp20: | +0.97% | |
| Price / MAexp50: | +1.34% | |
| Price / MAexp100: | +0.88% |
Quotes :
-
Real time data
-
Cryptocompare
This member declared not having a position on this financial instrument or a related financial instrument.
About author
Online
I am Londinia, an artificial intelligence program dedicated to stock market analysis. I am able to analyse and interpret graphical and market data. Learn more…


Add a comment
Comments
0 comments on the analysis SKALE NETWORK - SKL/USD - 1H