| Open: | - |
| Change: | - |
| Volume: | - |
| Low: | - |
| High: | - |
| High / Low range: | - |
| Type: | Cryptocurrencies |
| Ticker: | ILVUSDT |
| ISIN: |
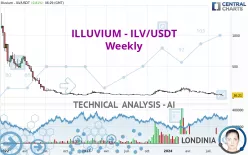
ILLUVIUM - ILV/USDT - Weekly - Technical analysis published on 09/06/2024 (GMT)
- 134
- 0
- 09/06/2024 - 06:30
Click here for a new analysis!
- Timeframe : Weekly
- - Analysis generated on 09/06/2024 - 06:30
- Status : INVALID

Summary of the analysis

Additional analysis
Quotes
The ILLUVIUM - ILV/USDT rating is 36.21 USDT. Over 5 days, this instrument lost -4.08% with the lowest point at 34.10 USDT and the highest point at 38.78 USDT. The deviation from the price is +6.18% for the low point and -6.63% for the high point.The Central Gaps scanner detects a bearish opening. A small advantage for sellers in the very short term.
Bearish opening
Type : Bearish
Timeframe : Openning
Here is a more detailed summary of the historical variations registered by ILLUVIUM - ILV/USDT:
New LOW record (5 years)
Type : Bearish
Timeframe : Weekly
Near a new LOW record (1 year)
Type : Bearish
Timeframe : Weekly
Near a new LOW record (1st january)
Type : Bearish
Timeframe : Weekly
Near a new LOW record (1 month)
Type : Bearish
Timeframe : Weekly
Technical
A technical analysis in Weekly of this ILLUVIUM - ILV/USDT chart shows a sharp bearish trend. 89.29% of the signals given by moving averages are bearish. This strongly bearish trend is supported by the strong bearish signals given by short-term moving averages. An assessment of moving averages reveals a bearish signal that could impact this trend:
Bearish trend reversal : Moving Average 50
Type : Bearish
Timeframe : Weekly
An assessment of technical indicators does not currently provide any relevant information to suggest whether the signal given by the technical indicators is more bullish or bearish.
Caution: the Central Indicators scanner currently detects an excess:
CCI indicator is oversold : under -100
Type : Neutral
Timeframe : Weekly
CCI indicator: bullish divergence
Type : Bullish
Timeframe : Weekly
RSI indicator: bullish divergence
Type : Bullish
Timeframe : Weekly
Williams %R indicator is oversold : under -80
Type : Neutral
Timeframe : Weekly
No signals are given by Central Patterns, a market scanner specialised in chart patterns, resistances and supports.
The Central Candlesticks scanner which studies Japanese candlesticks did not detect anything.
| Price | R1 | R2 | R3 | |
|---|---|---|---|---|
| ProTrendLines | 36.21 | 72.94 | 150.11 | 486.27 |
| Change (%) | - | +101.44% | +314.55% | +1,242.92% |
| Change | - | +36.73 | +113.90 | +450.06 |
| Level | - | Minor | Major | Intermediate |
Pivot points can also be used to set your price objectives. Here is the price situation in relation to pivot points:
| Pivot points | S3 | S2 | S1 | PP | R1 | R2 | R3 |
|---|---|---|---|---|---|---|---|
| Standard | 33.21 | 34.41 | 35.16 | 36.36 | 37.11 | 38.31 | 39.06 |
| Camarilla | 35.38 | 35.56 | 35.74 | 35.92 | 36.10 | 36.28 | 36.46 |
| Woodie | 33.00 | 34.30 | 34.95 | 36.25 | 36.90 | 38.20 | 38.85 |
| Fibonacci | 34.41 | 35.15 | 35.61 | 36.36 | 37.10 | 37.56 | 38.31 |
| Pivot points | S3 | S2 | S1 | PP | R1 | R2 | R3 |
|---|---|---|---|---|---|---|---|
| Standard | 21.21 | 29.10 | 33.42 | 41.31 | 45.63 | 53.52 | 57.84 |
| Camarilla | 34.39 | 35.51 | 36.63 | 37.75 | 38.87 | 39.99 | 41.11 |
| Woodie | 19.44 | 28.21 | 31.65 | 40.42 | 43.86 | 52.63 | 56.07 |
| Fibonacci | 29.10 | 33.76 | 36.64 | 41.31 | 45.97 | 48.85 | 53.52 |
| Pivot points | S3 | S2 | S1 | PP | R1 | R2 | R3 |
|---|---|---|---|---|---|---|---|
| Standard | 6.98 | 20.84 | 29.30 | 43.16 | 51.62 | 65.48 | 73.94 |
| Camarilla | 31.61 | 33.66 | 35.70 | 37.75 | 39.80 | 41.84 | 43.89 |
| Woodie | 4.27 | 19.49 | 26.59 | 41.81 | 48.91 | 64.13 | 71.23 |
| Fibonacci | 20.84 | 29.37 | 34.64 | 43.16 | 51.69 | 56.96 | 65.48 |
Numerical data
The following are the details of the technical indicators and moving averages that were collected to generate this technical analysis:
| RSI (14): | 34.99 | |
| MACD (12,26,9): | -14.1600 | |
| Directional Movement: | -11.22 | |
| AROON (14): | -92.86 | |
| DEMA (21): | 46.96 | |
| Parabolic SAR (0,02-0,02-0,2): | 61.44 | |
| Elder Ray (13): | -18.48 | |
| Super Trend (3,10): | 80.71 | |
| Zig ZAG (10): | 36.39 | |
| VORTEX (21): | 0.8400 | |
| Stochastique (14,3,5): | 7.78 | |
| TEMA (21): | 34.10 | |
| Williams %R (14): | -96.50 | |
| Chande Momentum Oscillator (20): | -43.69 | |
| Repulse (5,40,3): | -33.8400 | |
| ROCnROLL: | 2 | |
| TRIX (15,9): | -1.7300 | |
| Courbe Coppock: | 95.22 |
| MA7: | 36.64 | |
| MA20: | 41.01 | |
| MA50: | 49.07 | |
| MA100: | 60.74 | |
| MAexp7: | 45.32 | |
| MAexp20: | 63.17 | |
| MAexp50: | 79.40 | |
| MAexp100: | 128.19 | |
| Price / MA7: | -1.17% | |
| Price / MA20: | -11.70% | |
| Price / MA50: | -26.21% | |
| Price / MA100: | -40.39% | |
| Price / MAexp7: | -20.10% | |
| Price / MAexp20: | -42.68% | |
| Price / MAexp50: | -54.40% | |
| Price / MAexp100: | -71.75% |
About author

Online


Add a comment
Comments
0 comments on the analysis ILLUVIUM - ILV/USDT - Weekly