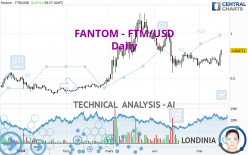
FANTOM - FTM/USD - Daily - Technical analysis published on 05/16/2024 (GMT)
- 81
- 0
Click here for a new analysis!
- Timeframe : Daily
- - Analysis generated on
- Status : TARGET REACHED

Summary of the analysis

Additional analysis
Quotes
The FANTOM - FTM/USD price is 0.808858 USD. On the day, this instrument gained +6.59% with the lowest point at 0.754863 USD and the highest point at 0.819008 USD. The deviation from the price is +7.15% for the low point and -1.24% for the high point.Here is a more detailed summary of the historical variations registered by FANTOM - FTM/USD:
New HIGH record (1 month)
Type : Bullish
Timeframe : Weekly
Technical
A technical analysis in Daily of this FANTOM - FTM/USD chart shows a bullish trend. The signals returned by the moving averages are 75.00% bullish. This bullish trend is reinforced by the strong signals currently being given by short-term moving averages. The Central Indicators scanner detects bullish signals on moving averages that could impact this trend:
Bullish trend reversal : Moving Average 20
Type : Bullish
Timeframe : Daily
Bullish trend reversal : adaptative moving average 20
Type : Bullish
Timeframe : Daily
Bullish trend reversal : adaptative moving average 50
Type : Bullish
Timeframe : Daily
Bullish trend reversal : adaptative moving average 100
Type : Bullish
Timeframe : Daily
Bullish price crossover with Moving Average 50
Type : Bullish
Timeframe : Daily
Bullish price crossover with adaptative moving average 20
Type : Bullish
Timeframe : Daily
Bullish price crossover with adaptative moving average 100
Type : Bullish
Timeframe : Daily
Technical indicators are strongly bullish, suggesting that the price increase should continue.
Caution: the Central Indicators scanner currently detects an excess:
CCI indicator is overbought : over 100
Type : Neutral
Timeframe : Daily
Williams %R indicator is overbought : over -20
Type : Neutral
Timeframe : Daily
Pivot points : price is over resistance 1
Type : Neutral
Timeframe : Daily
Pivot points : price is over resistance 2
Type : Neutral
Timeframe : Weekly
SuperTrend indicator bullish reversal
Type : Bullish
Timeframe : Daily
An analysis of the price chart with the Central Patterns scanner (detector of chart patterns and resistances and supports) shows a result that can have an impact on the price change:
Horizontal resistance is broken
Type : Bullish
Timeframe : Daily
The Central Candlesticks scanner which studies Japanese candlesticks did not detect anything.
| S3 | S2 | S1 | Price | R1 | R2 | R3 | |
|---|---|---|---|---|---|---|---|
| ProTrendLines | 0.556468 | 0.633200 | 0.798269 | 0.808858 | 1.016319 | 1.143874 | 1.628000 |
| Change (%) | -31.20% | -21.72% | -1.31% | - | +25.65% | +41.42% | +101.27% |
| Change | -0.252390 | -0.175658 | -0.010589 | - | +0.207461 | +0.335016 | +0.819142 |
| Level | Intermediate | Major | Minor | - | Minor | Major | Minor |
Attention could also be paid to pivot points to set price objectives:
| Pivot points | S3 | S2 | S1 | PP | R1 | R2 | R3 |
|---|---|---|---|---|---|---|---|
| Standard | 0.540312 | 0.588840 | 0.673837 | 0.722365 | 0.807362 | 0.855890 | 0.940887 |
| Camarilla | 0.722116 | 0.734355 | 0.746595 | 0.758835 | 0.771075 | 0.783315 | 0.795554 |
| Woodie | 0.558548 | 0.597957 | 0.692073 | 0.731482 | 0.825598 | 0.865007 | 0.959123 |
| Fibonacci | 0.588840 | 0.639846 | 0.671358 | 0.722365 | 0.773371 | 0.804883 | 0.855890 |
| Pivot points | S3 | S2 | S1 | PP | R1 | R2 | R3 |
|---|---|---|---|---|---|---|---|
| Standard | 0.571004 | 0.610841 | 0.660403 | 0.700240 | 0.749802 | 0.789639 | 0.839201 |
| Camarilla | 0.685381 | 0.693576 | 0.701771 | 0.709966 | 0.718161 | 0.726356 | 0.734551 |
| Woodie | 0.575868 | 0.613272 | 0.665267 | 0.702671 | 0.754666 | 0.792070 | 0.844065 |
| Fibonacci | 0.610841 | 0.644991 | 0.666089 | 0.700240 | 0.734390 | 0.755488 | 0.789639 |
| Pivot points | S3 | S2 | S1 | PP | R1 | R2 | R3 |
|---|---|---|---|---|---|---|---|
| Standard | -0.033068 | 0.262825 | 0.453623 | 0.749516 | 0.940314 | 1.236207 | 1.427005 |
| Camarilla | 0.510581 | 0.555194 | 0.599808 | 0.644421 | 0.689034 | 0.733648 | 0.778261 |
| Woodie | -0.085616 | 0.236551 | 0.401076 | 0.723242 | 0.887767 | 1.209933 | 1.374458 |
| Fibonacci | 0.262825 | 0.448741 | 0.563600 | 0.749516 | 0.935432 | 1.050291 | 1.236207 |
Numerical data
The following is the status of the technical indicators and moving averages at the time of publication of this technical analysis:
| RSI (14): | 60.32 | |
| MACD (12,26,9): | -0.0054 | |
| Directional Movement: | 5.907183 | |
| AROON (14): | 7.142857 | |
| DEMA (21): | 0.701357 | |
| Parabolic SAR (0,02-0,02-0,2): | 0.583933 | |
| Elder Ray (13): | 0.070825 | |
| Super Trend (3,10): | 0.613937 | |
| Zig ZAG (10): | 0.815081 | |
| VORTEX (21): | 1.0427 | |
| Stochastique (14,3,5): | 70.53 | |
| TEMA (21): | 0.719744 | |
| Williams %R (14): | -2.07 | |
| Chande Momentum Oscillator (20): | 0.121840 | |
| Repulse (5,40,3): | 17.3163 | |
| ROCnROLL: | 1 | |
| TRIX (15,9): | -0.4279 | |
| Courbe Coppock: | 7.85 |
| MA7: | 0.716525 | |
| MA20: | 0.700413 | |
| MA50: | 0.770575 | |
| MA100: | 0.714840 | |
| MAexp7: | 0.729052 | |
| MAexp20: | 0.716803 | |
| MAexp50: | 0.735569 | |
| MAexp100: | 0.691442 | |
| Price / MA7: | +12.89% | |
| Price / MA20: | +15.48% | |
| Price / MA50: | +4.97% | |
| Price / MA100: | +13.15% | |
| Price / MAexp7: | +10.95% | |
| Price / MAexp20: | +12.84% | |
| Price / MAexp50: | +9.96% | |
| Price / MAexp100: | +16.98% |
About author

Online


Add a comment
Comments
0 comments on the analysis FANTOM - FTM/USD - Daily