| Open: | - |
| Change: | - |
| Volume: | - |
| Low: | - |
| High: | - |
| High / Low range: | - |
| Type: | Stocks |
| Ticker: | EVTL |
| ISIN: | KYG9471C1078 |
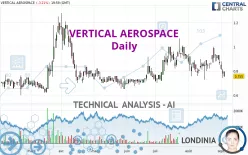
VERTICAL AEROSPACE - Daily - Technical analysis published on 09/06/2024 (GMT)
- 108
- 0
- 09/06/2024 - 06:46
Click here for a new analysis!
- Timeframe : Daily
- - Analysis generated on 09/06/2024 - 06:46
- Status : INVALID

Summary of the analysis

Additional analysis
Quotes
The VERTICAL AEROSPACE price is 0.7550 USD. On the day, this instrument lost -3.21% and was traded between 0.7521 USD and 0.8000 USD over the period. The price is currently at +0.39% from its lowest and -5.63% from its highest.The Central Gaps scanner detects a bullish opening. A small advantage for buyers in the very short term.
Bullish opening
Type : Bullish
Timeframe : Openning
Here is a more detailed summary of the historical variations registered by VERTICAL AEROSPACE:
Near a new LOW record (1 month)
Type : Bearish
Timeframe : Weekly
Technical
Technical analysis of VERTICAL AEROSPACE in Daily shows an overall bearish trend. 75.00% of the signals given by moving averages are bearish. The overall trend is reinforced by the strong bearish signals from short-term moving averages. The Central Indicators market scanner is currently detecting a bearish signal that could impact this trend:
Bearish trend reversal : Moving Average 50
Type : Bearish
Timeframe : Daily
An assessment of technical indicators does not currently provide any relevant information to suggest whether the signal given by the technical indicators is more bullish or bearish.
Caution: the Central Indicators scanner currently detects an excess:
CCI indicator is oversold : under -100
Type : Neutral
Timeframe : Daily
Williams %R indicator is oversold : under -80
Type : Neutral
Timeframe : Daily
Pivot points : price is under support 3
Type : Neutral
Timeframe : Weekly
Price is back under the pivot point
Type : Bearish
Timeframe : Daily
Central Patterns, the market scanner focusing on chart patterns, resistances and supports found this result:
Near support of triangle
Type : Bullish
Timeframe : Daily
No result was found by the Central Candlesticks scanner on Japanese candlesticks.
| S3 | S2 | S1 | Price | R1 | R2 | R3 | |
|---|---|---|---|---|---|---|---|
| ProTrendLines | 0.5078 | 0.5965 | 0.7168 | 0.7550 | 0.8036 | 0.9360 | 0.9998 |
| Change (%) | -32.74% | -20.99% | -5.06% | - | +6.44% | +23.97% | +32.42% |
| Change | -0.2472 | -0.1585 | -0.0382 | - | +0.0486 | +0.1810 | +0.2448 |
| Level | Minor | Major | Major | - | Major | Minor | Major |
Attention could also be paid to pivot points to set price objectives:
| Pivot points | S3 | S2 | S1 | PP | R1 | R2 | R3 |
|---|---|---|---|---|---|---|---|
| Standard | 0.6902 | 0.7211 | 0.7381 | 0.7690 | 0.7860 | 0.8169 | 0.8339 |
| Camarilla | 0.7418 | 0.7462 | 0.7506 | 0.7550 | 0.7594 | 0.7638 | 0.7682 |
| Woodie | 0.6832 | 0.7176 | 0.7311 | 0.7655 | 0.7790 | 0.8134 | 0.8269 |
| Fibonacci | 0.7211 | 0.7394 | 0.7507 | 0.7690 | 0.7873 | 0.7986 | 0.8169 |
| Pivot points | S3 | S2 | S1 | PP | R1 | R2 | R3 |
|---|---|---|---|---|---|---|---|
| Standard | 0.6603 | 0.7552 | 0.8102 | 0.9051 | 0.9601 | 1.0550 | 1.1100 |
| Camarilla | 0.8240 | 0.8377 | 0.8515 | 0.8652 | 0.8789 | 0.8927 | 0.9064 |
| Woodie | 0.6404 | 0.7452 | 0.7903 | 0.8951 | 0.9402 | 1.0450 | 1.0901 |
| Fibonacci | 0.7552 | 0.8125 | 0.8478 | 0.9051 | 0.9624 | 0.9977 | 1.0550 |
| Pivot points | S3 | S2 | S1 | PP | R1 | R2 | R3 |
|---|---|---|---|---|---|---|---|
| Standard | 0.4551 | 0.5911 | 0.7281 | 0.8641 | 1.0011 | 1.1371 | 1.2741 |
| Camarilla | 0.7901 | 0.8152 | 0.8402 | 0.8652 | 0.8902 | 0.9153 | 0.9403 |
| Woodie | 0.4557 | 0.5914 | 0.7287 | 0.8644 | 1.0017 | 1.1374 | 1.2747 |
| Fibonacci | 0.5911 | 0.6954 | 0.7598 | 0.8641 | 0.9684 | 1.0328 | 1.1371 |
Numerical data
The following are the details of the technical indicators and moving averages that were collected to generate this technical analysis:
| RSI (14): | 36.93 | |
| MACD (12,26,9): | -0.0106 | |
| Directional Movement: | -7.7596 | |
| AROON (14): | 42.8571 | |
| DEMA (21): | 0.8455 | |
| Parabolic SAR (0,02-0,02-0,2): | 0.9859 | |
| Elder Ray (13): | -0.0702 | |
| Super Trend (3,10): | 0.7481 | |
| Zig ZAG (10): | 0.7550 | |
| VORTEX (21): | 0.9263 | |
| Stochastique (14,3,5): | 21.10 | |
| TEMA (21): | 0.8254 | |
| Williams %R (14): | -89.74 | |
| Chande Momentum Oscillator (20): | -0.0950 | |
| Repulse (5,40,3): | -12.2261 | |
| ROCnROLL: | 2 | |
| TRIX (15,9): | 0.0299 | |
| Courbe Coppock: | 2.86 |
| MA7: | 0.8544 | |
| MA20: | 0.8506 | |
| MA50: | 0.8582 | |
| MA100: | 0.7973 | |
| MAexp7: | 0.8266 | |
| MAexp20: | 0.8534 | |
| MAexp50: | 0.8461 | |
| MAexp100: | 0.8333 | |
| Price / MA7: | -11.63% | |
| Price / MA20: | -11.24% | |
| Price / MA50: | -12.03% | |
| Price / MA100: | -5.31% | |
| Price / MAexp7: | -8.66% | |
| Price / MAexp20: | -11.53% | |
| Price / MAexp50: | -10.77% | |
| Price / MAexp100: | -9.40% |
News
The latest news and videos published on VERTICAL AEROSPACE at the time of the analysis were as follows:
- 01/27/2022 - 10:00 Dómhnal Slattery Appointed Vertical Chairman
About author

Online


Add a comment
Comments
0 comments on the analysis VERTICAL AEROSPACE - Daily