INTERCONTINENTAL EXCHANGE INC. - 1H - Technical analysis published on 02/06/2025 (GMT)
- 124
- 0
- Timeframe : 1H
- - Analysis generated on
- Status : WITHOUT TARGET
Summary of the analysis

Additional analysis
Quotes
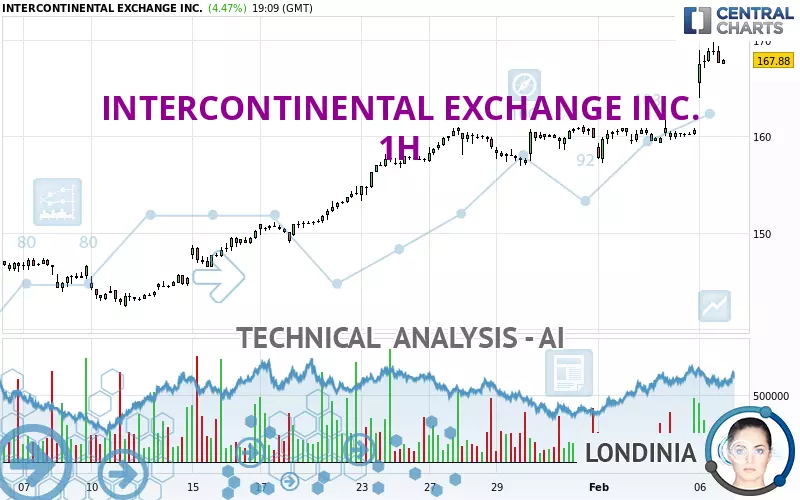
The INTERCONTINENTAL EXCHANGE INC. price is 167.88 USD. The price registered an increase of +4.47% on the session and was traded between 163.99 USD and 169.75 USD over the period. The price is currently at +2.37% from its lowest and -1.10% from its highest.Here is a more detailed summary of the historical variations registered by INTERCONTINENTAL EXCHANGE INC.:
New HIGH record (5 years)
Type : Bullish
Timeframe : Weekly
New HIGH record (1 year)
Type : Bullish
Timeframe : Weekly
New HIGH record (1st january)
Type : Bullish
Timeframe : Weekly
New HIGH record (1 month)
Type : Bullish
Timeframe : Weekly
Technical
Technical analysis of this 1H chart of INTERCONTINENTAL EXCHANGE INC. indicates that the overall trend is strongly bullish. 92.86% of the signals given by moving averages are bullish. This strongly bullish trend is supported by the strong bullish signals given by short-term moving averages. The Central Indicators market scanner currently does not detect any result that concerns moving averages.
Technical indicators are strongly bullish, suggesting that the price increase should continue.
Central Indicators, the detector scanner for these technical indicators has recently detected several signals:
Pivot points : price is over resistance 3
Type : Neutral
Timeframe : 1 hour
Pivot points : price is over resistance 3
Type : Neutral
Timeframe : Weekly
The Central Patterns scanner, which studies chart patterns, resistances and supports, has identified this signal:
Resistance of channel is broken
Type : Bullish
Timeframe : 1 hour
No result was found by the Central Candlesticks scanner on Japanese candlesticks.
| S3 | S2 | S1 | Price | |
|---|---|---|---|---|
| ProTrendLines | 157.56 | 160.79 | 166.42 | 167.88 |
| Change (%) | -6.15% | -4.22% | -0.87% | - |
| Change | -10.32 | -7.09 | -1.46 | - |
| Level | Major | Major | Major | - |
Attention could also be paid to pivot points to set price objectives:
| Pivot points | S3 | S2 | S1 | PP | R1 | R2 | R3 |
|---|---|---|---|---|---|---|---|
| Standard | 157.63 | 158.62 | 159.66 | 160.65 | 161.69 | 162.68 | 163.72 |
| Camarilla | 160.14 | 160.33 | 160.51 | 160.70 | 160.89 | 161.07 | 161.26 |
| Woodie | 157.66 | 158.63 | 159.69 | 160.66 | 161.72 | 162.69 | 163.75 |
| Fibonacci | 158.62 | 159.40 | 159.88 | 160.65 | 161.43 | 161.91 | 162.68 |
| Pivot points | S3 | S2 | S1 | PP | R1 | R2 | R3 |
|---|---|---|---|---|---|---|---|
| Standard | 153.21 | 155.08 | 157.45 | 159.32 | 161.69 | 163.56 | 165.93 |
| Camarilla | 158.66 | 159.05 | 159.44 | 159.83 | 160.22 | 160.61 | 161.00 |
| Woodie | 153.47 | 155.21 | 157.71 | 159.45 | 161.95 | 163.69 | 166.19 |
| Fibonacci | 155.08 | 156.70 | 157.70 | 159.32 | 160.94 | 161.94 | 163.56 |
| Pivot points | S3 | S2 | S1 | PP | R1 | R2 | R3 |
|---|---|---|---|---|---|---|---|
| Standard | 128.80 | 135.54 | 147.69 | 154.43 | 166.58 | 173.32 | 185.47 |
| Camarilla | 154.64 | 156.37 | 158.10 | 159.83 | 161.56 | 163.29 | 165.03 |
| Woodie | 131.50 | 136.89 | 150.39 | 155.78 | 169.28 | 174.67 | 188.17 |
| Fibonacci | 135.54 | 142.76 | 147.22 | 154.43 | 161.65 | 166.11 | 173.32 |
Numerical data
The following is the status of technical indicators and moving averages registered at the time this technical analysis was created:
| RSI (14): | 73.58 | |
| MACD (12,26,9): | 2.1900 | |
| Directional Movement: | 32.64 | |
| AROON (14): | 78.57 | |
| DEMA (21): | 166.17 | |
| Parabolic SAR (0,02-0,02-0,2): | 163.47 | |
| Elder Ray (13): | 2.77 | |
| Super Trend (3,10): | 164.48 | |
| Zig ZAG (10): | 167.81 | |
| VORTEX (21): | 1.1000 | |
| Stochastique (14,3,5): | 84.51 | |
| TEMA (21): | 167.68 | |
| Williams %R (14): | -17.05 | |
| Chande Momentum Oscillator (20): | 7.68 | |
| Repulse (5,40,3): | -0.3000 | |
| ROCnROLL: | 1 | |
| TRIX (15,9): | 0.1200 | |
| Courbe Coppock: | 8.34 |
| MA7: | 160.68 | |
| MA20: | 154.56 | |
| MA50: | 154.04 | |
| MA100: | 157.12 | |
| MAexp7: | 166.66 | |
| MAexp20: | 163.66 | |
| MAexp50: | 161.06 | |
| MAexp100: | 158.23 | |
| Price / MA7: | +4.48% | |
| Price / MA20: | +8.62% | |
| Price / MA50: | +8.98% | |
| Price / MA100: | +6.85% | |
| Price / MAexp7: | +0.73% | |
| Price / MAexp20: | +2.58% | |
| Price / MAexp50: | +4.23% | |
| Price / MAexp100: | +6.10% |
News
Don't forget to follow the news on INTERCONTINENTAL EXCHANGE INC.. At the time of publication of this analysis, the latest news was as follows:
- Intercontinental Exchange Announces 7% Increase to its Quarterly Dividend
- Intercontinental Exchange Reports Strong Full Year 2024 Results
- Intercontinental Exchange Reports January 2025 Statistics
- Intercontinental Exchange CFO Warren Gardiner to Present at the Bank of America Securities 2025 Financial Services Conference on February 11
- ICE Mortgage Monitor: 2024 Saw Softest Home Price Growth of Any Year Since 2011; Mortgage Delinquencies Gradually Trending Higher
About author
Online


Add a comment
Comments
0 comments on the analysis INTERCONTINENTAL EXCHANGE INC. - 1H