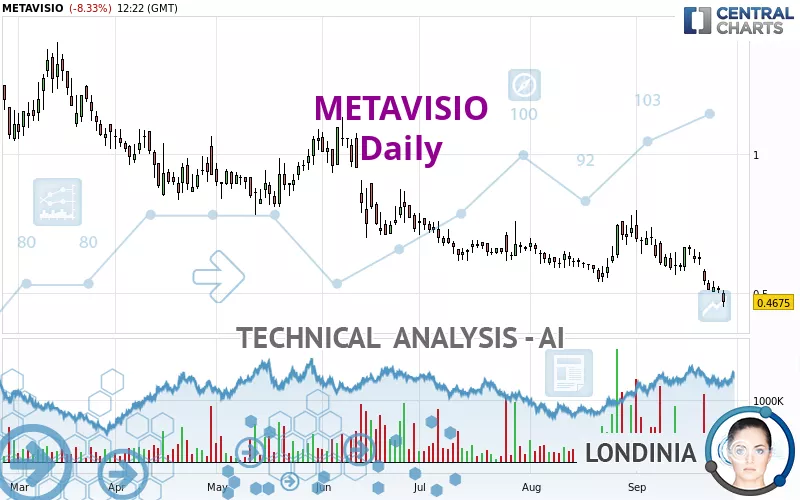
METAVISIO - Daily - Technical analysis published on 09/26/2024 (GMT)
- 130
- 0
Click here for a new analysis!
- Timeframe : Daily
- - Analysis generated on
- Status : TARGET REACHED

Summary of the analysis

Additional analysis
Quotes
The METAVISIO rating is 0.4675 EUR. The price is lower by -8.33% since the last closing with the lowest point at 0.4500 EUR and the highest point at 0.5100 EUR. The deviation from the price is +3.89% for the low point and -8.33% for the high point.The Central Gaps scanner detects a bearish gap which is a sign that the sellers have taken the lead in the very short term.
Opening Gap DOWN
Type : Bearish
Timeframe : Openning
So that you have an overall view of the price change, here is a table showing the variations over several periods:
New LOW record (5 years)
Type : Bearish
Timeframe : Weekly
New LOW record (1 year)
Type : Bearish
Timeframe : Weekly
New LOW record (1st january)
Type : Bearish
Timeframe : Weekly
New LOW record (1 month)
Type : Bearish
Timeframe : Weekly
Technical
Technical analysis of METAVISIO in Daily shows a overall strongly bearish trend. 92.86% of the signals given by moving averages are bearish. This strongly bearish trend is supported by the strong bearish signals given by short-term moving averages. There is no crossing of moving average by the price or crossing of moving averages between themselves.
In fact, of the 18 technical indicators analysed by Central Analyzer, 4 are bullish, 1 are neutral and 13 are bearish. Caution: the Central Indicators scanner currently detects an excess:
CCI indicator is oversold : under -100
Type : Neutral
Timeframe : Daily
Williams %R indicator is oversold : under -80
Type : Neutral
Timeframe : Daily
Pivot points : price is under support 1
Type : Neutral
Timeframe : Weekly
Pivot points : price is under support 3
Type : Neutral
Timeframe : Daily
Central Patterns, the scanner specializing in chart patterns, did not identify any signals.
No result was found by the Central Candlesticks scanner on Japanese candlesticks.
| Price | R1 | R2 | R3 | |
|---|---|---|---|---|
| ProTrendLines | 0.4675 | 0.6702 | 1.1011 | 1.4400 |
| Change (%) | - | +43.36% | +135.53% | +208.02% |
| Change | - | +0.2027 | +0.6336 | +0.9725 |
| Level | - | Major | Intermediate | Minor |
To determine price objectives, it is also possible to use the pivot points. Here is the price position in relation to pivot points:
| Pivot points | S3 | S2 | S1 | PP | R1 | R2 | R3 |
|---|---|---|---|---|---|---|---|
| Standard | 0.4767 | 0.4893 | 0.4997 | 0.5123 | 0.5227 | 0.5353 | 0.5457 |
| Camarilla | 0.5037 | 0.5058 | 0.5079 | 0.5100 | 0.5121 | 0.5142 | 0.5163 |
| Woodie | 0.4755 | 0.4888 | 0.4985 | 0.5118 | 0.5215 | 0.5348 | 0.5445 |
| Fibonacci | 0.4893 | 0.4981 | 0.5036 | 0.5123 | 0.5211 | 0.5266 | 0.5353 |
| Pivot points | S3 | S2 | S1 | PP | R1 | R2 | R3 |
|---|---|---|---|---|---|---|---|
| Standard | 0.3493 | 0.4397 | 0.4923 | 0.5827 | 0.6353 | 0.7257 | 0.7783 |
| Camarilla | 0.5057 | 0.5188 | 0.5319 | 0.5450 | 0.5581 | 0.5712 | 0.5843 |
| Woodie | 0.3305 | 0.4303 | 0.4735 | 0.5733 | 0.6165 | 0.7163 | 0.7595 |
| Fibonacci | 0.4397 | 0.4943 | 0.5280 | 0.5827 | 0.6373 | 0.6710 | 0.7257 |
| Pivot points | S3 | S2 | S1 | PP | R1 | R2 | R3 |
|---|---|---|---|---|---|---|---|
| Standard | 0.3480 | 0.4440 | 0.5900 | 0.6860 | 0.8320 | 0.9280 | 1.0740 |
| Camarilla | 0.6695 | 0.6916 | 0.7138 | 0.7360 | 0.7582 | 0.7804 | 0.8026 |
| Woodie | 0.3730 | 0.4565 | 0.6150 | 0.6985 | 0.8570 | 0.9405 | 1.0990 |
| Fibonacci | 0.4440 | 0.5364 | 0.5936 | 0.6860 | 0.7784 | 0.8356 | 0.9280 |
Numerical data
The following is the status of technical indicators and moving averages registered at the time this technical analysis was created:
| RSI (14): | 30.14 | |
| MACD (12,26,9): | -0.0384 | |
| Directional Movement: | -15.4433 | |
| AROON (14): | -100.0000 | |
| DEMA (21): | 0.5462 | |
| Parabolic SAR (0,02-0,02-0,2): | 0.5923 | |
| Elder Ray (13): | -0.0868 | |
| Super Trend (3,10): | 0.6456 | |
| Zig ZAG (10): | 0.4650 | |
| VORTEX (21): | 0.8045 | |
| Stochastique (14,3,5): | 6.18 | |
| TEMA (21): | 0.5214 | |
| Williams %R (14): | -93.93 | |
| Chande Momentum Oscillator (20): | -0.1655 | |
| Repulse (5,40,3): | -13.4918 | |
| ROCnROLL: | 2 | |
| TRIX (15,9): | -0.4125 | |
| Courbe Coppock: | 38.22 |
| MA7: | 0.5429 | |
| MA20: | 0.6155 | |
| MA50: | 0.6290 | |
| MA100: | 0.7310 | |
| MAexp7: | 0.5324 | |
| MAexp20: | 0.5886 | |
| MAexp50: | 0.6407 | |
| MAexp100: | 0.7192 | |
| Price / MA7: | -13.89% | |
| Price / MA20: | -24.05% | |
| Price / MA50: | -25.68% | |
| Price / MA100: | -36.05% | |
| Price / MAexp7: | -12.19% | |
| Price / MAexp20: | -20.57% | |
| Price / MAexp50: | -27.03% | |
| Price / MAexp100: | -35.00% |
News
The last news published on METAVISIO at the time of the generation of this analysis was as follows:
- METAVISIO - THOMSON - Exclusive distribution agreement with New Shop in India - Presence in over 300 outlets by October 2024, and 2,000 within 3 years
- METAVISIO - THOMSON COMPUTING: A 2024 SUMMER OF DEVELOPMENT
- METAVISIO - THOMSON COMPUTING WILL BE PRESENT AT THE IFA IN BERLIN IN SEPTEMBER.
- Official trip to India: rich in meetings, developments and contracts
- Metavisio (Thomson Computing) wins coveted award at Berlin's annual IFA!
About author

Online


Add a comment
Comments
0 comments on the analysis METAVISIO - Daily