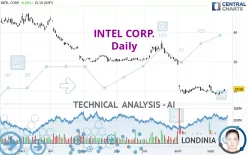
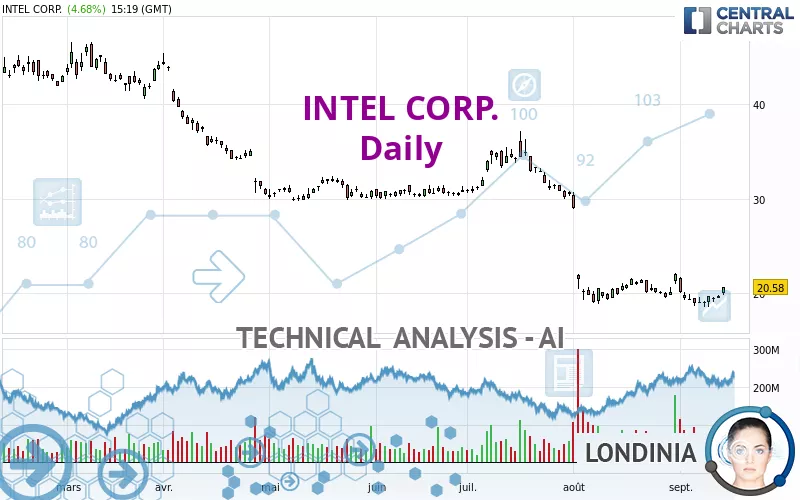
INTEL CORP. - Daily - Technical analysis published on 09/16/2024 (GMT)
- 234
- 0
Click here for a new analysis!
- Timeframe : Daily
- - Analysis generated on
- Status : INVALID
Summary of the analysis

Additional analysis
Quotes
The INTEL CORP. price is 20.58 USD. The price registered an increase of +4.68% on the session with the lowest point at 19.76 USD and the highest point at 20.59 USD. The deviation from the price is +4.15% for the low point and -0.05% for the high point.A bullish gap was detected at the opening by the Central Gaps scanner. There are a lot of buyers and they have the upper hand in the very short term.
Opening Gap UP
Type : Bullish
Timeframe : Openning
Here is a more detailed summary of the historical variations registered by INTEL CORP.:
Technical
A technical analysis in Daily of this INTEL CORP. chart shows a bearish trend. 75.00% of the signals given by moving averages are bearish. Caution: the neutral signals currently given by short-term moving averages show us that the global trend is losing momentum. The Central Indicators scanner detects bullish signals on moving averages that could impact this trend:
Bullish price crossover with Moving Average 20
Type : Bullish
Timeframe : Daily
Bullish price crossover with adaptative moving average 20
Type : Bullish
Timeframe : Daily
In fact, 10 technical indicators on 18 studied are currently bullish. Other results related to technical indicators were also found by the Central Indicators scanner:
Pivot points : price is over resistance 1
Type : Neutral
Timeframe : Weekly
Pivot points : price is over resistance 3
Type : Neutral
Timeframe : Daily
Momentum indicator is back over 0
Type : Bullish
Timeframe : Daily
Williams %R indicator is back over -50
Type : Bullish
Timeframe : Daily
Central Patterns, the market scanner focusing on chart patterns, resistances and supports found this result:
Near resistance of channel
Type : Bearish
Timeframe : Daily
The Central Candlesticks scanner which studies Japanese candlesticks did not detect anything.
| S3 | S2 | S1 | Price | R1 | R2 | R3 | |
|---|---|---|---|---|---|---|---|
| ProTrendLines | 7.60 | 15.78 | 18.97 | 20.58 | 23.91 | 29.67 | 34.66 |
| Change (%) | -63.07% | -23.32% | -7.82% | - | +16.18% | +44.17% | +68.42% |
| Change | -12.98 | -4.80 | -1.61 | - | +3.33 | +9.09 | +14.08 |
| Level | Minor | Major | Major | - | Intermediate | Intermediate | Intermediate |
To determine price objectives, it is also possible to use the pivot points. Here is the price position in relation to pivot points:
| Pivot points | S3 | S2 | S1 | PP | R1 | R2 | R3 |
|---|---|---|---|---|---|---|---|
| Standard | 19.19 | 19.34 | 19.50 | 19.65 | 19.81 | 19.96 | 20.12 |
| Camarilla | 19.58 | 19.60 | 19.63 | 19.66 | 19.69 | 19.72 | 19.75 |
| Woodie | 19.20 | 19.34 | 19.51 | 19.65 | 19.82 | 19.96 | 20.13 |
| Fibonacci | 19.34 | 19.46 | 19.53 | 19.65 | 19.77 | 19.84 | 19.96 |
| Pivot points | S3 | S2 | S1 | PP | R1 | R2 | R3 |
|---|---|---|---|---|---|---|---|
| Standard | 17.56 | 18.03 | 18.85 | 19.32 | 20.14 | 20.61 | 21.43 |
| Camarilla | 19.31 | 19.42 | 19.54 | 19.66 | 19.78 | 19.90 | 20.02 |
| Woodie | 17.73 | 18.12 | 19.02 | 19.41 | 20.31 | 20.70 | 21.60 |
| Fibonacci | 18.03 | 18.53 | 18.83 | 19.32 | 19.82 | 20.12 | 20.61 |
| Pivot points | S3 | S2 | S1 | PP | R1 | R2 | R3 |
|---|---|---|---|---|---|---|---|
| Standard | 5.40 | 12.12 | 17.08 | 23.80 | 28.76 | 35.48 | 40.44 |
| Camarilla | 18.83 | 19.90 | 20.97 | 22.04 | 23.11 | 24.18 | 25.25 |
| Woodie | 4.52 | 11.68 | 16.20 | 23.36 | 27.88 | 35.04 | 39.56 |
| Fibonacci | 12.12 | 16.58 | 19.34 | 23.80 | 28.26 | 31.02 | 35.48 |
Numerical data
The following are the details of the technical indicators and moving averages that were collected to generate this technical analysis:
| RSI (14): | 45.73 | |
| MACD (12,26,9): | -1.1700 | |
| Directional Movement: | -5.17 | |
| AROON (14): | -42.86 | |
| DEMA (21): | 18.55 | |
| Parabolic SAR (0,02-0,02-0,2): | 20.70 | |
| Elder Ray (13): | 0.29 | |
| Super Trend (3,10): | 21.75 | |
| Zig ZAG (10): | 20.41 | |
| VORTEX (21): | 0.8400 | |
| Stochastique (14,3,5): | 36.15 | |
| TEMA (21): | 19.21 | |
| Williams %R (14): | -48.06 | |
| Chande Momentum Oscillator (20): | 0.78 | |
| Repulse (5,40,3): | 4.3900 | |
| ROCnROLL: | -1 | |
| TRIX (15,9): | -1.0100 | |
| Courbe Coppock: | 8.86 |
| MA7: | 19.41 | |
| MA20: | 20.07 | |
| MA50: | 24.86 | |
| MA100: | 27.82 | |
| MAexp7: | 19.70 | |
| MAexp20: | 20.39 | |
| MAexp50: | 23.51 | |
| MAexp100: | 27.41 | |
| Price / MA7: | +6.03% | |
| Price / MA20: | +2.54% | |
| Price / MA50: | -17.22% | |
| Price / MA100: | -26.02% | |
| Price / MAexp7: | +4.42% | |
| Price / MAexp20: | +0.88% | |
| Price / MAexp50: | -12.51% | |
| Price / MAexp100: | -24.95% |
News
Don't forget to follow the news on INTEL CORP.. At the time of publication of this analysis, the latest news was as follows:
-
 Forbes on Intel woes: You know you're in trouble when you go to the government for help
- Acer Debuts New Swift Copilot+ PCs Powered by Intel Core Ultra Processors (Series 2)
- Karma Automotive Announces Bilateral Collaboration with Intel Automotive to Blueprint the Future of the Automobile
-
Intel is a 'broken company,' its decline is a 'death spiral moment': Gregg Smith
-
Iran working to influence US elections to keep Trump out of office: US intel
About author
Online


Add a comment
Comments
0 comments on the analysis INTEL CORP. - Daily