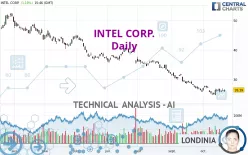
INTEL CORP. - Daily - Technical analysis published on 10/21/2022 (GMT)
- 328
- 0
Click here for a new analysis!
- Timeframe : Daily
- - Analysis generated on
- Status : INVALID

Summary of the analysis

Additional analysis
Quotes
The INTEL CORP. price is 26.39 USD. On the day, this instrument gained +1.19% and was between 25.79 USD and 26.63 USD. This implies that the price is at +2.33% from its lowest and at -0.90% from its highest.A bearish gap was detected at the opening by the Central Gaps scanner. There are a lot of sellers and they have the upper hand in the very short term.
Opening Gap DOWN
Type : Bearish
Timeframe : Openning
A study of price movements over other periods shows the following variations:
Near a new LOW record (5 years)
Type : Bearish
Timeframe : Weekly
Near a new LOW record (1 year)
Type : Bearish
Timeframe : Weekly
Near a new LOW record (1st january)
Type : Bearish
Timeframe : Weekly
Near a new LOW record (1 month)
Type : Bearish
Timeframe : Weekly
Technical
Technical analysis of this Daily chart of INTEL CORP. indicates that the overall trend is strongly bearish. 85.71% of the signals given by moving averages are bearish. The slightly bearish signals from short-term moving averages show that the overall trend is slowing down. There is no crossing of moving average by the price or crossing of moving averages between themselves.
Technical indicators are slightly bullish. There is therefore considerable uncertainty about the continuation of the increase.
Other results related to technical indicators were also found by the Central Indicators scanner:
Price is back over the pivot point
Type : Bullish
Timeframe : Daily
Williams %R indicator is back over -50
Type : Bullish
Timeframe : Daily
The Central Patterns scanner, which studies chart patterns, resistances and supports, has identified this signal:
Near horizontal resistance
Type : Bearish
Timeframe : Daily
Central Candlesticks, the scanner specialised in Japanese candlesticks, detects a bullish signal that could support the hypothesis of a small rebound in the very short term:
Bullish engulfing lines
Type : Bullish
Timeframe : Daily
| S3 | S2 | S1 | Price | R1 | R2 | R3 | |
|---|---|---|---|---|---|---|---|
| ProTrendLines | 8.12 | 16.94 | 21.64 | 26.39 | 26.42 | 30.81 | 36.43 |
| Change (%) | -69.23% | -35.81% | -18.00% | - | +0.11% | +16.75% | +38.04% |
| Change | -18.27 | -9.45 | -4.75 | - | +0.03 | +4.42 | +10.04 |
| Level | Minor | Minor | Major | - | Intermediate | Minor | Minor |
Pivot points can also be used to set your price objectives. Here is the price situation in relation to pivot points:
| Pivot points | S3 | S2 | S1 | PP | R1 | R2 | R3 |
|---|---|---|---|---|---|---|---|
| Standard | 24.69 | 25.31 | 25.70 | 26.32 | 26.71 | 27.33 | 27.72 |
| Camarilla | 25.80 | 25.90 | 25.99 | 26.08 | 26.17 | 26.27 | 26.36 |
| Woodie | 24.57 | 25.25 | 25.58 | 26.26 | 26.59 | 27.27 | 27.60 |
| Fibonacci | 25.31 | 25.70 | 25.94 | 26.32 | 26.71 | 26.95 | 27.33 |
| Pivot points | S3 | S2 | S1 | PP | R1 | R2 | R3 |
|---|---|---|---|---|---|---|---|
| Standard | 22.48 | 23.54 | 24.72 | 25.78 | 26.96 | 28.02 | 29.20 |
| Camarilla | 25.29 | 25.50 | 25.71 | 25.91 | 26.12 | 26.32 | 26.53 |
| Woodie | 22.55 | 23.57 | 24.79 | 25.81 | 27.03 | 28.05 | 29.27 |
| Fibonacci | 23.54 | 24.39 | 24.92 | 25.78 | 26.63 | 27.16 | 28.02 |
| Pivot points | S3 | S2 | S1 | PP | R1 | R2 | R3 |
|---|---|---|---|---|---|---|---|
| Standard | 16.91 | 21.32 | 23.55 | 27.96 | 30.19 | 34.60 | 36.83 |
| Camarilla | 23.94 | 24.55 | 25.16 | 25.77 | 26.38 | 26.99 | 27.60 |
| Woodie | 15.81 | 20.78 | 22.45 | 27.42 | 29.09 | 34.06 | 35.73 |
| Fibonacci | 21.32 | 23.86 | 25.43 | 27.96 | 30.50 | 32.07 | 34.60 |
Numerical data
The following is the status of technical indicators and moving averages registered at the time this technical analysis was created:
| RSI (14): | 42.02 | |
| MACD (12,26,9): | -1.0100 | |
| Directional Movement: | -7.18 | |
| AROON (14): | -42.85 | |
| DEMA (21): | 25.21 | |
| Parabolic SAR (0,02-0,02-0,2): | 24.73 | |
| Elder Ray (13): | -0.07 | |
| Super Trend (3,10): | 27.91 | |
| Zig ZAG (10): | 26.30 | |
| VORTEX (21): | 0.8800 | |
| Stochastique (14,3,5): | 47.18 | |
| TEMA (21): | 25.66 | |
| Williams %R (14): | -48.31 | |
| Chande Momentum Oscillator (20): | -1.39 | |
| Repulse (5,40,3): | -0.7000 | |
| ROCnROLL: | -1 | |
| TRIX (15,9): | -0.6500 | |
| Courbe Coppock: | 6.89 |
| MA7: | 26.14 | |
| MA20: | 26.35 | |
| MA50: | 29.74 | |
| MA100: | 33.89 | |
| MAexp7: | 26.11 | |
| MAexp20: | 26.75 | |
| MAexp50: | 29.42 | |
| MAexp100: | 33.22 | |
| Price / MA7: | +0.96% | |
| Price / MA20: | +0.15% | |
| Price / MA50: | -11.26% | |
| Price / MA100: | -22.13% | |
| Price / MAexp7: | +1.07% | |
| Price / MAexp20: | -1.35% | |
| Price / MAexp50: | -10.30% | |
| Price / MAexp100: | -20.56% |
News
The latest news and videos published on INTEL CORP. at the time of the analysis were as follows:
- Media Alert: Intel at KubeCon + CloudNativeCon North America 2022
- Intel Ignite Expands Startup Acceleration Program to Boston
- Chipsea CSC2E101 as the First EC Chip Included in Intel PCL from Chinese Mainland
- Thinking about buying stock in Pineapple Energy, Knowbe4, Intel, Norwegian Cruise Line, or Nio?
- Supermicro JumpStart Early Access Program Accelerates Time to Market for Upcoming 4th Gen Intel Xeon Scalable Processor Systems
About author

Online


Add a comment
Comments
0 comments on the analysis INTEL CORP. - Daily