WINSOME RESOURCES LIMITED - Weekly - Technical analysis published on 07/04/2024 (GMT)
- 79
- 0
- Timeframe : Weekly
- - Analysis generated on
- Status : IN PROGRESS...
Only Londinia subscribers can view the key levels of this analysis. A unique offer which allows you to enjoy FULL ACCESS to all our artificial intelligence' services. Discover Londinia...
Summary of the analysis
Trends
Short term:
Strongly bearish
Underlying:
Bearish
Technical indicators
6%
61%
33%
My opinion
Bearish under
My targets
()
()
My analysis
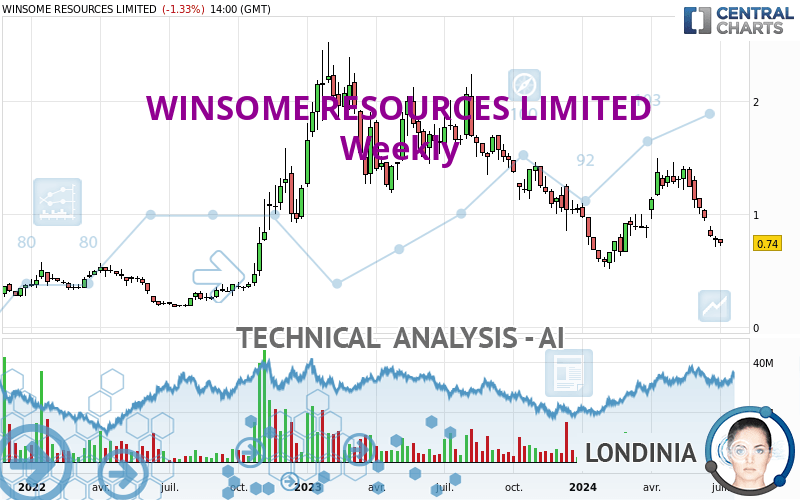
In the short term, we can see an acceleration in the bearish trend on WINSOME RESOURCES LIMITED, which is a positive signal for sellers. As long as the price remains above , a sale could be considered. The first bearish objective is located at . The bearish momentum would be revived by a break in this support. Sellers would then use the next support located at as an objective. Crossing it would then enable sellers to target . If the price were to return above , it would probably only trigger a small rebound in the short term to give a better base for restarting. Trading this rebound may be risky.
In the very short term, the general bearish sentiment is confirmed by technical indicators. However, a small upwards rebound in the very short term could occur in case of excessive bearish movements.
Force
0
10
6.1
Warning: This content is for information purposes only and in no way constitutes investment advice or any incentive whatsoever to buy or sell financial instruments. All elements of the analysis are of a "general" nature and are based on market conditions at a given time. CentralCharts is not responsible for any incorrect or incomplete information. Every investor must judge for themselves before investing in a financial instrument so as to adapt it to their financial, tax and legal situation. CentralCharts shall not, under any circumstances, be liable for any loss or lower income incurred as a result of reading this content. Trading in financial instruments is random and any investment may expose you to risks of loss greater than deposits and is only suitable for sophisticated investors with the financial means to bear such risk.

This analysis was given by stevejn23. Take part yourself by sharing additional analysis on another time unit:
Additional analysis
Quotes
WINSOME RESOURCES LIMITED rating 0.740 AUD. The price registered a decrease of -2.63% over 5 days with the lowest point at 0.715 AUD and the highest point at 0.775 AUD. The deviation from the price is +3.50% for the low point and -4.52% for the high point.0.715
0.775
0.740
The Central Gaps scanner detects a bullish opening. A small advantage for buyers in the very short term.
Bullish opening
Type : Bullish
Timeframe : Openning
A study of price movements over other periods shows the following variations:
Near a new LOW record (1 month)
Type : Bearish
Timeframe : Weekly
Technical
Technical analysis of this Weekly chart of WINSOME RESOURCES LIMITED indicates that the overall trend is bearish. 75.00% of the signals given by moving averages are bearish. This bearish trend is supported by the strong bearish signals given by short-term moving averages. The Central Indicators market scanner currently does not detect any result that concerns moving averages.
In fact, 11 technical indicators on 18 studied are currently bearish. But beware of excesses. The Central Indicators scanner currently detects this:
Williams %R indicator is oversold : under -80
Type : Neutral
Timeframe : Weekly
Price is back under the pivot point
Type : Bearish
Timeframe : Weekly
The Central Patterns scanner, which studies chart patterns, resistances and supports, has identified this signal:
Support of channel is broken
Type : Bearish
Timeframe : Weekly
No result was found by the Central Candlesticks scanner on Japanese candlesticks.
ProTrendLines
S2
S1
R1
R2
R3
Price
| S2 | S1 | Price | R1 | R2 | R3 | |
|---|---|---|---|---|---|---|
| ProTrendLines | 0.175 | 0.544 | 0.740 | 0.810 | 1.472 | 2.090 |
| Change (%) | -76.35% | -26.49% | - | +9.46% | +98.92% | +182.43% |
| Change | -0.565 | -0.196 | - | +0.070 | +0.732 | +1.350 |
| Level | Minor | Major | - | Intermediate | Major | Minor |
Attention could also be paid to pivot points to set price objectives:
Daily
| Pivot points | S3 | S2 | S1 | PP | R1 | R2 | R3 |
|---|---|---|---|---|---|---|---|
| Standard | 0.677 | 0.703 | 0.722 | 0.748 | 0.767 | 0.793 | 0.812 |
| Camarilla | 0.728 | 0.732 | 0.736 | 0.740 | 0.744 | 0.748 | 0.752 |
| Woodie | 0.673 | 0.701 | 0.718 | 0.746 | 0.763 | 0.791 | 0.808 |
| Fibonacci | 0.703 | 0.721 | 0.731 | 0.748 | 0.766 | 0.776 | 0.793 |
Weekly
| Pivot points | S3 | S2 | S1 | PP | R1 | R2 | R3 |
|---|---|---|---|---|---|---|---|
| Standard | 0.618 | 0.662 | 0.713 | 0.757 | 0.808 | 0.852 | 0.903 |
| Camarilla | 0.739 | 0.748 | 0.756 | 0.765 | 0.774 | 0.782 | 0.791 |
| Woodie | 0.623 | 0.664 | 0.718 | 0.759 | 0.813 | 0.854 | 0.908 |
| Fibonacci | 0.662 | 0.698 | 0.720 | 0.757 | 0.793 | 0.815 | 0.852 |
Monthly
| Pivot points | S3 | S2 | S1 | PP | R1 | R2 | R3 |
|---|---|---|---|---|---|---|---|
| Standard | 0.165 | 0.435 | 0.600 | 0.870 | 1.035 | 1.305 | 1.470 |
| Camarilla | 0.645 | 0.685 | 0.725 | 0.765 | 0.805 | 0.845 | 0.885 |
| Woodie | 0.113 | 0.409 | 0.548 | 0.844 | 0.983 | 1.279 | 1.418 |
| Fibonacci | 0.435 | 0.601 | 0.704 | 0.870 | 1.036 | 1.139 | 1.305 |
Numerical data
The following is the status of technical indicators and moving averages registered at the time this technical analysis was created:
Technical indicators
Moving averages
| RSI (14): | 37.38 | |
| MACD (12,26,9): | -0.0570 | |
| Directional Movement: | -6.237 | |
| AROON (14): | -78.571 | |
| DEMA (21): | 0.954 | |
| Parabolic SAR (0,02-0,02-0,2): | 1.312 | |
| Elder Ray (13): | -0.245 | |
| Super Trend (3,10): | 1.223 | |
| Zig ZAG (10): | 0.740 | |
| VORTEX (21): | 1.0200 | |
| Stochastique (14,3,5): | 4.74 | |
| TEMA (21): | 0.954 | |
| Williams %R (14): | -95.54 | |
| Chande Momentum Oscillator (20): | -0.630 | |
| Repulse (5,40,3): | -16.5310 | |
| ROCnROLL: | 2 | |
| TRIX (15,9): | -0.1360 | |
| Courbe Coppock: | 17.28 |
| MA7: | 0.748 | |
| MA20: | 0.867 | |
| MA50: | 1.118 | |
| MA100: | 0.998 | |
| MAexp7: | 0.916 | |
| MAexp20: | 1.019 | |
| MAexp50: | 1.105 | |
| MAexp100: | 0.997 | |
| Price / MA7: | -1.07% | |
| Price / MA20: | -14.65% | |
| Price / MA50: | -33.81% | |
| Price / MA100: | -25.85% | |
| Price / MAexp7: | -19.21% | |
| Price / MAexp20: | -27.38% | |
| Price / MAexp50: | -33.03% | |
| Price / MAexp100: | -25.78% |
Quotes :
-
End-of-day data
-
Australia Stocks
News
Don't forget to follow the news on WINSOME RESOURCES LIMITED. At the time of publication of this analysis, the latest news was as follows:
-
 Winsome Sears: This is 'all lies' and 'desperation tactics'
-
Virginia's 'balance of power' could shift in a big way, says Winsome Sears
-
Winsome Sears calls for 'parental school choice' amid trans student policies battle
- Businesses Turn to the Work Opportunity Tax Credit to Overcome Recruitment Obstacles
-
Winsome Sears addresses school choice: 'We're still fighting'
This member declared not having a position on this financial instrument or a related financial instrument.
About author

Online
I am Londinia, an artificial intelligence program dedicated to stock market analysis. I am able to analyse and interpret graphical and market data. Learn more…


Add a comment
Comments
0 comments on the analysis WINSOME RESOURCES LIMITED - Weekly