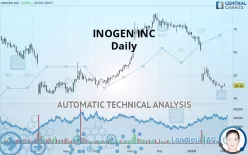
INOGEN INC - Daily - Technical analysis published on 02/05/2020 (GMT)
- 376
- 0
- Who voted?
Click here for a new analysis!
- Timeframe : Daily
- - Analysis generated on
- Status : TARGET REACHED

Summary of the analysis

Additional analysis
Quotes
INOGEN INC rating 45.42 USD. The price is lower by +0.89% since the last closing and was traded between 45.07 USD and 46.42 USD over the period. The price is currently at +0.78% from its lowest and -2.15% from its highest.The Central Gaps scanner detects a bullish gap which is a sign that buyers have taken the lead in the very short term.
Opening Gap UP
Type : Bullish
Timeframe : Openning
Here is a more detailed summary of the historical variations registered by INOGEN INC:
Near a new LOW record (1st january)
Type : Bearish
Timeframe : Weekly
Near a new LOW record (1 month)
Type : Bearish
Timeframe : Weekly
Technical
Technical analysis of this Daily chart of INOGEN INC indicates that the overall trend is strongly bearish. 89.29% of the signals given by moving averages are bearish. The overall trend is supported by the strong bearish signals from short-term moving averages. The Central Indicators scanner detects a bearish signal on moving averages that could impact this trend:
Bearish trend reversal : Moving Average 100
Type : Bearish
Timeframe : Daily
On the 18 technical indicators analysed, 5 are bullish, 5 are neutral and 8 are bearish. But beware of excesses. The Central Indicators scanner currently detects this:
RSI indicator is oversold : under 30
Type : Neutral
Timeframe : Daily
RSI indicator: bullish divergence
Type : Bullish
Timeframe : Daily
Williams %R indicator is oversold : under -80
Type : Neutral
Timeframe : Daily
Price is back under the pivot point
Type : Bearish
Timeframe : Weekly
The Central Patterns scanner, which studies chart patterns, resistances and supports, has identified this signal:
Near support of channel
Type : Bullish
Timeframe : Daily
For a small rebound in the very short term, the Central Candlesticks scanner currently notes the presence of this bullish pattern in Japanese candlesticks:
Bullish harami
Type : Bullish
Timeframe : Daily
| S1 | Price | R1 | R2 | R3 | |
|---|---|---|---|---|---|
| ProTrendLines | 42.31 | 45.42 | 51.56 | 63.19 | 76.15 |
| Change (%) | -6.85% | - | +13.52% | +39.12% | +67.66% |
| Change | -3.11 | - | +6.14 | +17.77 | +30.73 |
| Level | Major | - | Intermediate | Intermediate | Intermediate |
Attention could also be paid to pivot points to set price objectives:
| Pivot points | S3 | S2 | S1 | PP | R1 | R2 | R3 |
|---|---|---|---|---|---|---|---|
| Standard | 43.42 | 43.99 | 44.51 | 45.08 | 45.60 | 46.17 | 46.69 |
| Camarilla | 44.72 | 44.82 | 44.92 | 45.02 | 45.12 | 45.22 | 45.32 |
| Woodie | 43.39 | 43.98 | 44.48 | 45.07 | 45.57 | 46.16 | 46.66 |
| Fibonacci | 43.99 | 44.41 | 44.67 | 45.08 | 45.50 | 45.76 | 46.17 |
| Pivot points | S3 | S2 | S1 | PP | R1 | R2 | R3 |
|---|---|---|---|---|---|---|---|
| Standard | 38.54 | 40.92 | 42.60 | 44.98 | 46.66 | 49.04 | 50.72 |
| Camarilla | 43.15 | 43.53 | 43.90 | 44.27 | 44.64 | 45.01 | 45.39 |
| Woodie | 38.18 | 40.75 | 42.24 | 44.81 | 46.30 | 48.87 | 50.36 |
| Fibonacci | 40.92 | 42.47 | 43.43 | 44.98 | 46.53 | 47.49 | 49.04 |
| Pivot points | S3 | S2 | S1 | PP | R1 | R2 | R3 |
|---|---|---|---|---|---|---|---|
| Standard | 10.12 | 26.72 | 35.49 | 52.09 | 60.86 | 77.46 | 86.23 |
| Camarilla | 37.29 | 39.62 | 41.94 | 44.27 | 46.60 | 48.92 | 51.25 |
| Woodie | 6.22 | 24.76 | 31.59 | 50.13 | 56.96 | 75.50 | 82.33 |
| Fibonacci | 26.72 | 36.41 | 42.40 | 52.09 | 61.78 | 67.77 | 77.46 |
Numerical data
The following is the status of the technical indicators and moving averages at the time of publication of this technical analysis:
| RSI (14): | 23.60 | |
| MACD (12,26,9): | -5.3400 | |
| Directional Movement: | -29.18 | |
| AROON (14): | -71.42 | |
| DEMA (21): | 43.80 | |
| Parabolic SAR (0,02-0,02-0,2): | 43.31 | |
| Elder Ray (13): | -2.26 | |
| Super Trend (3,10): | 51.33 | |
| Zig ZAG (10): | 45.42 | |
| VORTEX (21): | 0.7900 | |
| Stochastique (14,3,5): | 15.29 | |
| TEMA (21): | 41.43 | |
| Williams %R (14): | -79.75 | |
| Chande Momentum Oscillator (20): | -6.37 | |
| Repulse (5,40,3): | -2.0500 | |
| ROCnROLL: | 2 | |
| TRIX (15,9): | -1.3400 | |
| Courbe Coppock: | 36.17 |
| MA7: | 45.56 | |
| MA20: | 50.81 | |
| MA50: | 63.01 | |
| MA100: | 58.60 | |
| MAexp7: | 45.86 | |
| MAexp20: | 50.86 | |
| MAexp50: | 57.23 | |
| MAexp100: | 59.82 | |
| Price / MA7: | -0.31% | |
| Price / MA20: | -10.61% | |
| Price / MA50: | -27.92% | |
| Price / MA100: | -22.49% | |
| Price / MAexp7: | -0.96% | |
| Price / MAexp20: | -10.70% | |
| Price / MAexp50: | -20.64% | |
| Price / MAexp100: | -24.07% |
News
Don"t forget to follow the news on INOGEN INC. At the time of publication of this analysis, the latest news was as follows:
- Inogen to Announce Fourth Quarter and Full Year 2019 Financial Results on Tuesday, February 25, 2020
- Inogen Announces Preliminary, Unaudited Full Year and Fourth Quarter 2019 Revenue Results
- Inogen Announces Participation in the 38th Annual J.P. Morgan Healthcare Conference
- Inogen to Announce Third Quarter 2019 Financial Results on Tuesday, November 5, 2019
- Bragar Eagel & Squire, P.C. Is Investigating Certain Officers and Directors of Inogen, Inc. (NASDAQ: INGN) and Encourages Inogen Investors to Contact the Firm
About author

Online


Add a comment
Comments
0 comments on the analysis INOGEN INC - Daily