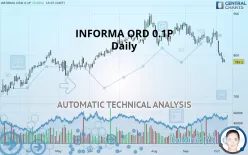
INFORMA ORD 0.1P - Daily - Technical analysis published on 10/08/2019 (GMT)
- 359
- 0
- Who voted?
Click here for a new analysis!
- Timeframe : Daily
- - Analysis generated on
- Status : TARGET REACHED

Summary of the analysis

Additional analysis
Quotes
INFORMA ORD 0.1P rating 783.2 GBX. On the day, this instrument gained +0.03% and was traded between 781.4 GBX and 788.4 GBX over the period. The price is currently at +0.23% from its lowest and -0.66% from its highest.The Central Gaps scanner detects a bullish opening marking the presence of buyers ahead of sellers at the opening but not sufficiently marked to allow the price to register a quotation gap.
Bullish opening
Type : Bullish
Timeframe : Openning
A study of price movements over other periods shows the following variations:
Near a new LOW record (1 month)
Type : Bearish
Timeframe : Weekly
Technical
Technical analysis of this Daily chart of INFORMA ORD 0.1P indicates that the overall trend is bearish. The signals given by moving averages are 67.86% bearish. This bearish trend is reinforced by the strong signals currently being given by short-term moving averages. The Central Indicators market scanner is currently detecting a bearish signal that could impact this trend:
Moving Average bearish crossovers : AMA50 & AMA100
Type : Bearish
Timeframe : Daily
An assessment of technical indicators does not currently provide any relevant information to suggest whether the signal given by the technical indicators is more bullish or bearish.
But beware of excesses. The Central Indicators scanner currently detects this:
CCI indicator is oversold : under -100
Type : Neutral
Timeframe : Daily
Williams %R indicator is oversold : under -80
Type : Neutral
Timeframe : Daily
Price is back under the pivot point
Type : Bearish
Timeframe : Daily
Price is back under the pivot point
Type : Bearish
Timeframe : Weekly
The Central Patterns scanner, which studies chart patterns, resistances and supports, has identified these signals:
Support of channel is broken
Type : Bearish
Timeframe : Daily
Support of triangle is broken
Type : Bearish
Timeframe : Daily
No result was found by the Central Candlesticks scanner on Japanese candlesticks.
| S3 | S2 | S1 | Price | R1 | R2 | R3 | |
|---|---|---|---|---|---|---|---|
| ProTrendLines | 659.4 | 696.4 | 761.0 | 783.2 | 806.0 | 859.0 | 892.0 |
| Change (%) | -15.81% | -11.08% | -2.83% | - | +2.91% | +9.68% | +13.89% |
| Change | -123.8 | -86.8 | -22.2 | - | +22.8 | +75.8 | +108.8 |
| Level | Intermediate | Major | Major | - | Intermediate | Major | Intermediate |
Attention could also be paid to pivot points to set price objectives:
| Pivot points | S3 | S2 | S1 | PP | R1 | R2 | R3 |
|---|---|---|---|---|---|---|---|
| Standard | 760.5 | 770.5 | 776.7 | 786.7 | 792.9 | 802.9 | 809.1 |
| Camarilla | 778.6 | 780.0 | 781.5 | 783.0 | 784.5 | 786.0 | 787.5 |
| Woodie | 758.7 | 769.6 | 774.9 | 785.8 | 791.1 | 802.0 | 807.3 |
| Fibonacci | 770.5 | 776.7 | 780.5 | 786.7 | 792.9 | 796.7 | 802.9 |
| Pivot points | S3 | S2 | S1 | PP | R1 | R2 | R3 |
|---|---|---|---|---|---|---|---|
| Standard | 704.7 | 747.5 | 772.3 | 815.1 | 839.9 | 882.7 | 907.5 |
| Camarilla | 778.4 | 784.6 | 790.8 | 797.0 | 803.2 | 809.4 | 815.6 |
| Woodie | 695.6 | 743.0 | 763.2 | 810.6 | 830.8 | 878.2 | 898.4 |
| Fibonacci | 747.5 | 773.4 | 789.3 | 815.1 | 841.0 | 856.9 | 882.7 |
| Pivot points | S3 | S2 | S1 | PP | R1 | R2 | R3 |
|---|---|---|---|---|---|---|---|
| Standard | 760.5 | 789.5 | 820.7 | 849.7 | 880.9 | 909.9 | 941.1 |
| Camarilla | 835.5 | 841.0 | 846.5 | 852.0 | 857.5 | 863.0 | 868.6 |
| Woodie | 761.7 | 790.1 | 821.9 | 850.3 | 882.1 | 910.5 | 942.3 |
| Fibonacci | 789.5 | 812.5 | 826.7 | 849.7 | 872.7 | 886.9 | 909.9 |
Numerical data
The following is the status of technical indicators and moving averages registered at the time this technical analysis was created:
| RSI (14): | 30.60 | |
| MACD (12,26,9): | -13.8000 | |
| Directional Movement: | -17.7 | |
| AROON (14): | -42.9 | |
| DEMA (21): | 808.0 | |
| Parabolic SAR (0,02-0,02-0,2): | 848.6 | |
| Elder Ray (13): | -30.3 | |
| Super Trend (3,10): | 834.6 | |
| Zig ZAG (10): | 783.8 | |
| VORTEX (21): | 0.8000 | |
| Stochastique (14,3,5): | 5.30 | |
| TEMA (21): | 795.9 | |
| Williams %R (14): | -96.60 | |
| Chande Momentum Oscillator (20): | -57.8 | |
| Repulse (5,40,3): | -3.4000 | |
| ROCnROLL: | 2 | |
| TRIX (15,9): | -0.1000 | |
| Courbe Coppock: | 8.00 |
| MA7: | 808.5 | |
| MA20: | 828.1 | |
| MA50: | 842.0 | |
| MA100: | 824.9 | |
| MAexp7: | 802.7 | |
| MAexp20: | 823.3 | |
| MAexp50: | 831.7 | |
| MAexp100: | 817.5 | |
| Price / MA7: | -3.13% | |
| Price / MA20: | -5.42% | |
| Price / MA50: | -6.98% | |
| Price / MA100: | -5.06% | |
| Price / MAexp7: | -2.43% | |
| Price / MAexp20: | -4.87% | |
| Price / MAexp50: | -5.83% | |
| Price / MAexp100: | -4.20% |
News
Don"t forget to follow the news on INFORMA ORD 0.1P. At the time of publication of this analysis, the latest news was as follows:
- Introducing Informa Tech
- Informa Markets Launches New Brand Identity
- Informa Exhibitions Named Top Global Exhibition Organizer by AMR International
- Mark Temple-Smith appointed Managing Director of Fashion Exhibitions Business at Informa
- Invesco Ltd. : Form 8.3 - Informa Plc
About author

Online


Add a comment
Comments
0 comments on the analysis INFORMA ORD 0.1P - Daily