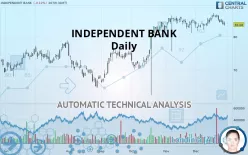
INDEPENDENT BANK - Daily - Technical analysis published on 12/30/2019 (GMT)
- 169
- 0
- Who voted?
Click here for a new analysis!
- Timeframe : Daily
- - Analysis generated on
- Status : INVALID

Summary of the analysis

Additional analysis
Quotes
The INDEPENDENT BANK price is 83.68 USD. The price is lower by -0.12% since the last closing and was between 83.29 USD and 84.60 USD. This implies that the price is at +0.47% from its lowest and at -1.09% from its highest.The Central Gaps scanner detects a bullish opening. A small advantage for buyers in the very short term.
Bullish opening
Type : Bullish
Timeframe : Openning
A study of price movements over other periods shows the following variations:
Near a new HIGH record (1 year)
Type : Bullish
Timeframe : Weekly
Near a new HIGH record (1st january)
Type : Bullish
Timeframe : Weekly
Technical
A technical analysis in Daily of this INDEPENDENT BANK chart shows a bullish trend. The signals given by moving averages are 67.86% bullish. This bullish trend could slow down given the slightly bearish signals currently being given by short-term moving averages. An assessment of moving averages reveals several bearish signals that could impact this trend:
Bearish trend reversal : Moving Average 20
Type : Bearish
Timeframe : Daily
Bearish price crossover with Moving Average 20
Type : Bearish
Timeframe : Daily
Bearish price crossover with adaptative moving average 20
Type : Bearish
Timeframe : Daily
Bearish price crossover with adaptative moving average 50
Type : Bearish
Timeframe : Daily
The technical indicators are generally neutral. They do not provide relevant information on the direction of future price movements.
Central Indicators, the detector scanner for these technical indicators has recently detected several signals:
RSI indicator is back under 50
Type : Bearish
Timeframe : Daily
Parabolic SAR indicator bearish reversal
Type : Bearish
Timeframe : Daily
Price is back under the pivot point
Type : Bearish
Timeframe : Daily
Price is back under the pivot point
Type : Bearish
Timeframe : Weekly
Williams %R indicator is back under -50
Type : Bearish
Timeframe : Daily
Central Patterns, the market scanner focusing on chart patterns, resistances and supports found this result:
Near support of channel
Type : Bullish
Timeframe : Daily
Central Candlesticks, the scanner specialised in Japanese candlesticks, detects a bearish signal that could support the hypothesis of a small drop in the very short term:
Bearish engulfing lines
Type : Bearish
Timeframe : Daily
| S3 | S2 | S1 | Price | R1 | R2 | R3 | |
|---|---|---|---|---|---|---|---|
| ProTrendLines | 69.35 | 75.97 | 82.68 | 83.68 | 85.60 | 87.35 | 92.40 |
| Change (%) | -17.12% | -9.21% | -1.20% | - | +2.29% | +4.39% | +10.42% |
| Change | -14.33 | -7.71 | -1.00 | - | +1.92 | +3.67 | +8.72 |
| Level | Minor | Major | Intermediate | - | Major | Major | Minor |
Pivot points can also be used to set your price objectives. Here is the price situation in relation to pivot points:
| Pivot points | S3 | S2 | S1 | PP | R1 | R2 | R3 |
|---|---|---|---|---|---|---|---|
| Standard | 81.92 | 82.77 | 83.28 | 84.13 | 84.64 | 85.49 | 86.00 |
| Camarilla | 83.41 | 83.53 | 83.66 | 83.78 | 83.91 | 84.03 | 84.15 |
| Woodie | 81.74 | 82.69 | 83.10 | 84.05 | 84.46 | 85.41 | 85.82 |
| Fibonacci | 82.77 | 83.29 | 83.61 | 84.13 | 84.65 | 84.97 | 85.49 |
| Pivot points | S3 | S2 | S1 | PP | R1 | R2 | R3 |
|---|---|---|---|---|---|---|---|
| Standard | 79.64 | 81.42 | 82.38 | 84.16 | 85.13 | 86.91 | 87.87 |
| Camarilla | 82.59 | 82.84 | 83.10 | 83.35 | 83.60 | 83.85 | 84.10 |
| Woodie | 79.23 | 81.21 | 81.97 | 83.96 | 84.72 | 86.71 | 87.47 |
| Fibonacci | 81.42 | 82.47 | 83.11 | 84.16 | 85.21 | 85.86 | 86.91 |
| Pivot points | S3 | S2 | S1 | PP | R1 | R2 | R3 |
|---|---|---|---|---|---|---|---|
| Standard | 66.54 | 70.84 | 77.30 | 81.60 | 88.06 | 92.35 | 98.82 |
| Camarilla | 80.81 | 81.79 | 82.78 | 83.77 | 84.75 | 85.74 | 86.72 |
| Woodie | 67.63 | 71.38 | 78.39 | 82.14 | 89.15 | 92.90 | 99.90 |
| Fibonacci | 70.84 | 74.95 | 77.49 | 81.60 | 85.71 | 88.24 | 92.35 |
Numerical data
The following is the status of technical indicators and moving averages registered at the time this technical analysis was created:
| RSI (14): | 48.19 | |
| MACD (12,26,9): | 0.4100 | |
| Directional Movement: | -5.37 | |
| AROON (14): | 50.00 | |
| DEMA (21): | 84.89 | |
| Parabolic SAR (0,02-0,02-0,2): | 86.60 | |
| Elder Ray (13): | -0.42 | |
| Super Trend (3,10): | 81.56 | |
| Zig ZAG (10): | 83.61 | |
| VORTEX (21): | 0.9100 | |
| Stochastique (14,3,5): | 42.84 | |
| TEMA (21): | 84.32 | |
| Williams %R (14): | -74.79 | |
| Chande Momentum Oscillator (20): | 0.51 | |
| Repulse (5,40,3): | -2.1100 | |
| ROCnROLL: | -1 | |
| TRIX (15,9): | 0.1000 | |
| Courbe Coppock: | 3.10 |
| MA7: | 84.58 | |
| MA20: | 84.08 | |
| MA50: | 83.70 | |
| MA100: | 77.26 | |
| MAexp7: | 84.33 | |
| MAexp20: | 84.20 | |
| MAexp50: | 82.40 | |
| MAexp100: | 79.68 | |
| Price / MA7: | -1.06% | |
| Price / MA20: | -0.48% | |
| Price / MA50: | -0.02% | |
| Price / MA100: | +8.31% | |
| Price / MAexp7: | -0.77% | |
| Price / MAexp20: | -0.62% | |
| Price / MAexp50: | +1.55% | |
| Price / MAexp100: | +5.02% |
About author

Online


Add a comment
Comments
0 comments on the analysis INDEPENDENT BANK - Daily