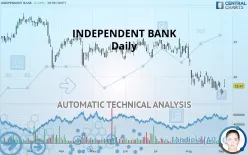
INDEPENDENT BANK - Daily - Technical analysis published on 09/06/2019 (GMT)
- 239
- 0
- Who voted?
Click here for a new analysis!
- Timeframe : Daily
- - Analysis generated on
- Status : TARGET REACHED

Summary of the analysis

Additional analysis
Quotes
The INDEPENDENT BANK price is 19.47 USD. On the day, this instrument gained +2.04% and was traded between 19.40 USD and 19.87 USD over the period. The price is currently at +0.36% from its lowest and -2.01% from its highest.The Central Gaps scanner detects a bullish gap which is a sign that buyers have taken the lead in the very short term.
Opening Gap UP
Type : Bullish
Timeframe : Openning
A study of price movements over other periods shows the following variations:
Near a new LOW record (1 year)
Type : Bearish
Timeframe : Weekly
Near a new LOW record (1st january)
Type : Bearish
Timeframe : Weekly
Technical
Technical analysis of INDEPENDENT BANK in Daily shows a overall strongly bearish trend. The signals given by moving averages are 92.86% bearish. This strong bearish trend is confirmed by the strong signals currently being given by short-term moving averages. The Central Indicators scanner does not detect any result on moving averages that would impact this trend.
An assessment of technical indicators does not currently provide any relevant information to suggest whether the signal given by the technical indicators is more bullish or bearish.
But beware of excesses. The Central Indicators scanner currently detects this:
MACD indicator: bullish divergence
Type : Bullish
Timeframe : Daily
Pivot points : price is over resistance 2
Type : Neutral
Timeframe : Daily
MACD crosses UP its Moving Average
Type : Bullish
Timeframe : Daily
Parabolic SAR indicator bullish reversal
Type : Bullish
Timeframe : Daily
Price is back under the pivot point
Type : Bearish
Timeframe : Daily
The analysis of the price chart with Central Patterns scanners does not return any result.
The Central Candlesticks scanner which studies Japanese candlesticks did not detect anything.
| S3 | S2 | S1 | Price | R1 | R2 | R3 | |
|---|---|---|---|---|---|---|---|
| ProTrendLines | 15.19 | 17.00 | 19.40 | 19.47 | 20.39 | 21.12 | 22.21 |
| Change (%) | -21.98% | -12.69% | -0.36% | - | +4.73% | +8.47% | +14.07% |
| Change | -4.28 | -2.47 | -0.07 | - | +0.92 | +1.65 | +2.74 |
| Level | Minor | Minor | Major | - | Major | Major | Intermediate |
Attention could also be paid to pivot points to set price objectives:
| Pivot points | S3 | S2 | S1 | PP | R1 | R2 | R3 |
|---|---|---|---|---|---|---|---|
| Standard | 18.67 | 18.83 | 18.95 | 19.11 | 19.23 | 19.39 | 19.51 |
| Camarilla | 19.00 | 19.03 | 19.05 | 19.08 | 19.11 | 19.13 | 19.16 |
| Woodie | 18.66 | 18.82 | 18.94 | 19.10 | 19.22 | 19.38 | 19.50 |
| Fibonacci | 18.83 | 18.93 | 19.00 | 19.11 | 19.21 | 19.28 | 19.39 |
| Pivot points | S3 | S2 | S1 | PP | R1 | R2 | R3 |
|---|---|---|---|---|---|---|---|
| Standard | 18.56 | 18.89 | 19.16 | 19.50 | 19.77 | 20.10 | 20.37 |
| Camarilla | 19.26 | 19.32 | 19.38 | 19.43 | 19.49 | 19.54 | 19.60 |
| Woodie | 18.52 | 18.88 | 19.13 | 19.48 | 19.73 | 20.09 | 20.34 |
| Fibonacci | 18.89 | 19.13 | 19.27 | 19.50 | 19.73 | 19.87 | 20.10 |
| Pivot points | S3 | S2 | S1 | PP | R1 | R2 | R3 |
|---|---|---|---|---|---|---|---|
| Standard | 15.79 | 17.51 | 18.47 | 20.19 | 21.15 | 22.87 | 23.83 |
| Camarilla | 18.69 | 18.94 | 19.18 | 19.43 | 19.68 | 19.92 | 20.17 |
| Woodie | 15.41 | 17.32 | 18.09 | 20.00 | 20.77 | 22.68 | 23.45 |
| Fibonacci | 17.51 | 18.53 | 19.17 | 20.19 | 21.21 | 21.85 | 22.87 |
Numerical data
The following are the details of the technical indicators and moving averages that were collected to generate this technical analysis:
| RSI (14): | 42.78 | |
| MACD (12,26,9): | -0.4100 | |
| Directional Movement: | -9.92 | |
| AROON (14): | -71.42 | |
| DEMA (21): | 19.19 | |
| Parabolic SAR (0,02-0,02-0,2): | 18.94 | |
| Elder Ray (13): | 0.10 | |
| Super Trend (3,10): | 20.35 | |
| Zig ZAG (10): | 19.47 | |
| VORTEX (21): | 0.8900 | |
| Stochastique (14,3,5): | 19.61 | |
| TEMA (21): | 19.12 | |
| Williams %R (14): | -61.03 | |
| Chande Momentum Oscillator (20): | -0.63 | |
| Repulse (5,40,3): | -2.5400 | |
| ROCnROLL: | 2 | |
| TRIX (15,9): | -0.3100 | |
| Courbe Coppock: | 4.75 |
| MA7: | 19.36 | |
| MA20: | 19.67 | |
| MA50: | 20.75 | |
| MA100: | 21.17 | |
| MAexp7: | 19.38 | |
| MAexp20: | 19.75 | |
| MAexp50: | 20.43 | |
| MAexp100: | 21.01 | |
| Price / MA7: | +0.57% | |
| Price / MA20: | -1.02% | |
| Price / MA50: | -6.17% | |
| Price / MA100: | -8.03% | |
| Price / MAexp7: | +0.46% | |
| Price / MAexp20: | -1.42% | |
| Price / MAexp50: | -4.70% | |
| Price / MAexp100: | -7.33% |
News
The latest news and videos published on INDEPENDENT BANK at the time of the analysis were as follows:
- Independent Bank Opens New SmithGroup-designed Headquarters at McKinney Corporate Center Craig Ranch
- SHAREHOLDER ALERT: Monteverde & Associates PC Launches An Investigation of the Board of Directors and Officers of Idaho Independent Bank - IIBK
- ALERT: Rowley Law PLLC is Investigating Proposed Acquisition of Idaho Independent Bank
- ALERT: Rowley Law PLLC is Investigating Proposed Acquisition of Blue Hills Bancorp, Inc.
- Independent Bank Breaks Ground On New Headquarters, Designed by SmithGroupJJR
About author

Online


Add a comment
Comments
0 comments on the analysis INDEPENDENT BANK - Daily