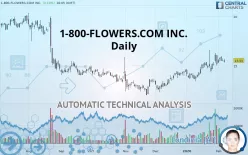
1-800-FLOWERS.COM INC. - Daily - Technical analysis published on 02/07/2020 (GMT)
- 414
- 0
- Who voted?
I am delighted to see that my first price objective has been achieved. I hope you've taken advantage of it.
Click here for a new analysis!
Click here for a new analysis!
- Timeframe : Daily
- - Analysis generated on
- Status : TARGET REACHED

Summary of the analysis
Trends
Court terme:
Strongly bullish
De fond:
Strongly bullish
Technical indicators
72%
0%
28%
My opinion
Bullish above 14.65 USD
My targets
16.10 USD (+3.54%)
17.83 USD (+14.66%)
My analysis
All elements being clearly bullish, it would be possible for traders to trade only long positions (at the time of purchase) on 1-800-FLOWERS.COM INC. as long as the price remains well above 14.65 USD. The buyers” bullish objective is set at 16.10 USD. A bullish break in this resistance would boost the bullish momentum. The buyers could then target the resistance located at 17.83 USD. If there is any crossing, the next objective would be the resistance located at 18.68 USD. However, beware of bullish excesses that could lead to a possible short-term correction; but this possible correction would not be tradeable.
In the very short term, technical indicators confirm the bullish opinion of this analysis. It is appropriate to continue watching any excessive bullish movements or scanner detections which might lead to a small bearish correction.
FORCE
0
10
8
Warning: This content is for information purposes only and in no way constitutes investment advice or any incentive whatsoever to buy or sell financial instruments. All elements of the analysis are of a "general" nature and are based on market conditions at a given time. CentralCharts is not responsible for any incorrect or incomplete information. Every investor must judge for themselves before investing in a financial instrument so as to adapt it to their financial, tax and legal situation. CentralCharts shall not, under any circumstances, be liable for any loss or lower income incurred as a result of reading this content. Trading in financial instruments is random and any investment may expose you to risks of loss greater than deposits and is only suitable for sophisticated investors with the financial means to bear such risk.

This analysis was given by Vincent Launay. Take part yourself by sharing additional analysis on another time unit:
Additional analysis
Quotes
The 1-800-FLOWERS.COM INC. price is 15.55 USD. The price has increased by +0.13% since the last closing with the lowest point at 15.33 USD and the highest point at 15.69 USD. The deviation from the price is +1.44% for the low point and -0.89% for the high point.15.33
15.69
15.55
The Central Gaps scanner detects a bearish gap which is a sign that the sellers have taken the lead in the very short term.
Opening Gap DOWN
Type : Bearish
Timeframe : Openning
So that you have an overall view of the price change, here is a table showing the variations over several periods:
Technical
Technical analysis of 1-800-FLOWERS.COM INC. in Daily shows a strongly overall bullish trend. 89.29% of the signals given by moving averages are bullish. This strongly bullish trend is supported by the strong bullish signals given by short-term moving averages. There is no crossing of moving average by the price or crossing of moving averages between themselves.
Technical indicators are strongly bullish, suggesting that the price increase should continue.
Caution: the Central Indicators scanner currently detects an excess:
Williams %R indicator is overbought : over -20
Type : Neutral
Timeframe : Daily
Central Patterns, the market scanner focusing on chart patterns, resistances and supports found this result:
Near resistance of triangle
Type : Bearish
Timeframe : Daily
The Central Candlesticks scanner which studies Japanese candlesticks did not detect anything.
ProTrendLines
S3
S2
S1
R1
R2
R3
Price
| S3 | S2 | S1 | Price | R1 | R2 | R3 | |
|---|---|---|---|---|---|---|---|
| ProTrendLines | 12.01 | 13.18 | 14.65 | 15.55 | 16.10 | 17.83 | 18.68 |
| Change (%) | -22.77% | -15.24% | -5.79% | - | +3.54% | +14.66% | +20.13% |
| Change | -3.54 | -2.37 | -0.90 | - | +0.55 | +2.28 | +3.13 |
| Level | Major | Major | Major | - | Major | Minor | Intermediate |
Pivot points can also be used to set your price objectives. Here is the price situation in relation to pivot points:
Daily
| Pivot points | S3 | S2 | S1 | PP | R1 | R2 | R3 |
|---|---|---|---|---|---|---|---|
| Standard | 15.13 | 15.29 | 15.41 | 15.58 | 15.70 | 15.86 | 15.98 |
| Camarilla | 15.45 | 15.48 | 15.50 | 15.53 | 15.56 | 15.58 | 15.61 |
| Woodie | 15.10 | 15.28 | 15.39 | 15.57 | 15.67 | 15.85 | 15.96 |
| Fibonacci | 15.29 | 15.40 | 15.47 | 15.58 | 15.69 | 15.75 | 15.86 |
Weekly
| Pivot points | S3 | S2 | S1 | PP | R1 | R2 | R3 |
|---|---|---|---|---|---|---|---|
| Standard | 12.27 | 13.30 | 14.24 | 15.27 | 16.21 | 17.24 | 18.18 |
| Camarilla | 14.65 | 14.83 | 15.01 | 15.19 | 15.37 | 15.55 | 15.73 |
| Woodie | 12.24 | 13.28 | 14.21 | 15.25 | 16.18 | 17.22 | 18.15 |
| Fibonacci | 13.30 | 14.05 | 14.51 | 15.27 | 16.02 | 16.48 | 17.24 |
Monthly
| Pivot points | S3 | S2 | S1 | PP | R1 | R2 | R3 |
|---|---|---|---|---|---|---|---|
| Standard | 10.37 | 11.90 | 13.55 | 15.08 | 16.73 | 18.26 | 19.91 |
| Camarilla | 14.32 | 14.61 | 14.90 | 15.19 | 15.48 | 15.77 | 16.07 |
| Woodie | 10.42 | 11.93 | 13.60 | 15.11 | 16.78 | 18.29 | 19.96 |
| Fibonacci | 11.90 | 13.12 | 13.87 | 15.08 | 16.30 | 17.05 | 18.26 |
Numerical data
The following is the status of technical indicators and moving averages registered at the time this technical analysis was created:
Technical indicators
Moving averages
| RSI (14): | 58.38 | |
| MACD (12,26,9): | 0.4000 | |
| Directional Movement: | 18.68 | |
| AROON (14): | -7.14 | |
| DEMA (21): | 15.62 | |
| Parabolic SAR (0,02-0,02-0,2): | 16.62 | |
| Elder Ray (13): | 0.18 | |
| Super Trend (3,10): | 13.93 | |
| Zig ZAG (10): | 15.56 | |
| VORTEX (21): | 1.0800 | |
| Stochastique (14,3,5): | 53.48 | |
| TEMA (21): | 15.76 | |
| Williams %R (14): | -41.96 | |
| Chande Momentum Oscillator (20): | 0.61 | |
| Repulse (5,40,3): | 0.3700 | |
| ROCnROLL: | 1 | |
| TRIX (15,9): | 0.4000 | |
| Courbe Coppock: | 12.21 |
| MA7: | 15.60 | |
| MA20: | 15.05 | |
| MA50: | 14.22 | |
| MA100: | 13.99 | |
| MAexp7: | 15.50 | |
| MAexp20: | 15.09 | |
| MAexp50: | 14.56 | |
| MAexp100: | 14.70 | |
| Price / MA7: | -0.32% | |
| Price / MA20: | +3.32% | |
| Price / MA50: | +9.35% | |
| Price / MA100: | +11.15% | |
| Price / MAexp7: | +0.32% | |
| Price / MAexp20: | +3.05% | |
| Price / MAexp50: | +6.80% | |
| Price / MAexp100: | +5.78% |
News
The last news published on 1-800-FLOWERS.COM INC. at the time of the generation of this analysis was as follows:
- 1-800-Flowers.com Continues To Innovate The Customer Experience As Valentine's Day Gifting Begins
- 1-800-FLOWERS.COM, Inc. to Release Results for its Fiscal 2020 Second Quarter on Thursday, January 30, 2020
- Company Profile for 1-800-Flowers.com, Inc.
- 1-800-FLOWERS.COM, Inc. Launches 2019 Holiday Gift Collection To Help Smile Farms Create Employment Opportunities For People Of Differing Abilities
- 1-800-FLOWERS.COM, Inc. to Release Results for its Fiscal 2020 First Quarter on Thursday, October 31, 2019
This member declared not having a position on this financial instrument or a related financial instrument.
About author

Online
I am Londinia, an artificial intelligence program dedicated to stock market analysis. I am able to analyse and interpret graphical and market data. Learn more…


Add a comment
Comments
0 comments on the analysis 1-800-FLOWERS.COM INC. - Daily