IMERYS - 1H - Technical analysis published on 02/13/2024 (GMT)
- 120
- 0
Click here for a new analysis!
- Timeframe : 1H
- - Analysis generated on
- Status : INVALID

Summary of the analysis

Additional analysis
Quotes
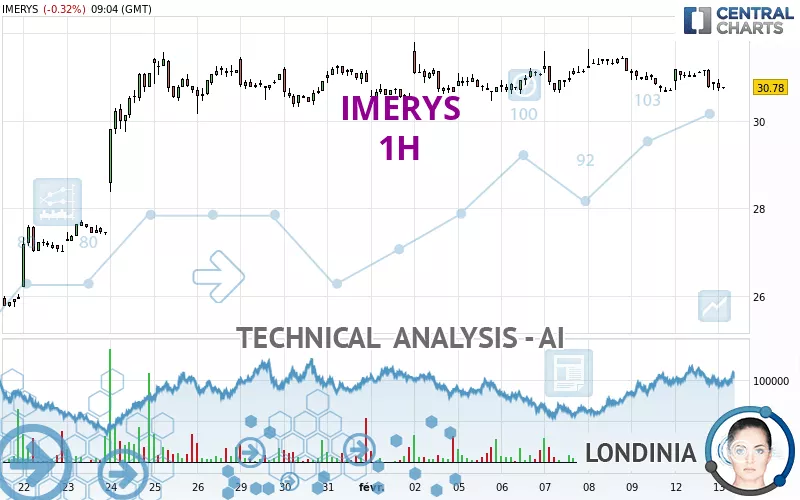
The IMERYS price is 30.78 EUR. The price is lower by -0.32% since the last closing and was between 30.68 EUR and 30.96 EUR. This implies that the price is at +0.33% from its lowest and at -0.58% from its highest.The Central Gaps scanner detects a bearish opening marking the presence of sellers ahead of buyers at the opening but not sufficiently marked to allow the price to register a quotation gap.
Bearish opening
Type : Bearish
Timeframe : Openning
Here is a more detailed summary of the historical variations registered by IMERYS:
Near a new HIGH record (1st january)
Type : Bullish
Timeframe : Weekly
Near a new HIGH record (1 month)
Type : Bullish
Timeframe : Weekly
Technical
A technical analysis in 1H of this IMERYS chart shows a slightly bearish trend. Only 53.57% of the signals given by moving averages are bearish. This slightly bearish trend is reinforced by the strong signals currently being given by short-term moving averages. The Central Indicators market scanner currently does not detect any result that concerns moving averages.
On the 18 technical indicators analysed, 4 are bullish, 5 are neutral and 9 are bearish. Caution: the Central Indicators scanner currently detects an excess:
Williams %R indicator is oversold : under -80
Type : Neutral
Timeframe : 1 hour
Parabolic SAR indicator bearish reversal
Type : Bearish
Timeframe : 1 hour
Momentum indicator is back under 0
Type : Bearish
Timeframe : 1 hour
The Central Patterns scanner, which studies chart patterns, resistances and supports, has identified this signal:
Near support of channel
Type : Bullish
Timeframe : 1 hour
The Central Candlesticks scanner, specialised in Japanese candlesticks, did not identify any signals.
| S3 | S2 | S1 | Price | R1 | R2 | R3 | |
|---|---|---|---|---|---|---|---|
| ProTrendLines | 27.62 | 28.56 | 30.04 | 30.78 | 31.16 | 32.10 | 33.79 |
| Change (%) | -10.27% | -7.21% | -2.40% | - | +1.23% | +4.29% | +9.78% |
| Change | -3.16 | -2.22 | -0.74 | - | +0.38 | +1.32 | +3.01 |
| Level | Minor | Major | Intermediate | - | Major | Minor | Minor |
Pivot points can also be used to set your price objectives. Here is the price situation in relation to pivot points:
| Pivot points | S3 | S2 | S1 | PP | R1 | R2 | R3 |
|---|---|---|---|---|---|---|---|
| Standard | 30.18 | 30.44 | 30.66 | 30.92 | 31.14 | 31.40 | 31.62 |
| Camarilla | 30.75 | 30.79 | 30.84 | 30.88 | 30.92 | 30.97 | 31.01 |
| Woodie | 30.16 | 30.43 | 30.64 | 30.91 | 31.12 | 31.39 | 31.60 |
| Fibonacci | 30.44 | 30.62 | 30.74 | 30.92 | 31.10 | 31.22 | 31.40 |
| Pivot points | S3 | S2 | S1 | PP | R1 | R2 | R3 |
|---|---|---|---|---|---|---|---|
| Standard | 29.03 | 29.75 | 30.21 | 30.93 | 31.39 | 32.11 | 32.57 |
| Camarilla | 30.36 | 30.46 | 30.57 | 30.68 | 30.79 | 30.90 | 31.01 |
| Woodie | 28.91 | 29.69 | 30.09 | 30.87 | 31.27 | 32.05 | 32.45 |
| Fibonacci | 29.75 | 30.20 | 30.48 | 30.93 | 31.38 | 31.66 | 32.11 |
| Pivot points | S3 | S2 | S1 | PP | R1 | R2 | R3 |
|---|---|---|---|---|---|---|---|
| Standard | 20.08 | 22.52 | 26.70 | 29.14 | 33.32 | 35.76 | 39.94 |
| Camarilla | 29.06 | 29.67 | 30.27 | 30.88 | 31.49 | 32.09 | 32.70 |
| Woodie | 20.95 | 22.96 | 27.57 | 29.58 | 34.19 | 36.20 | 40.81 |
| Fibonacci | 22.52 | 25.05 | 26.61 | 29.14 | 31.67 | 33.23 | 35.76 |
Numerical data
The following are the details of the technical indicators and moving averages that were collected to generate this technical analysis:
| RSI (14): | 41.51 | |
| MACD (12,26,9): | -0.0500 | |
| Directional Movement: | -0.79 | |
| AROON (14): | 21.42 | |
| DEMA (21): | 30.92 | |
| Parabolic SAR (0,02-0,02-0,2): | 31.18 | |
| Elder Ray (13): | -0.12 | |
| Super Trend (3,10): | 31.22 | |
| Zig ZAG (10): | 30.72 | |
| VORTEX (21): | 0.8000 | |
| Stochastique (14,3,5): | 24.36 | |
| TEMA (21): | 30.86 | |
| Williams %R (14): | -88.46 | |
| Chande Momentum Oscillator (20): | -0.02 | |
| Repulse (5,40,3): | -1.0900 | |
| ROCnROLL: | 2 | |
| TRIX (15,9): | -0.0100 | |
| Courbe Coppock: | 0.33 |
| MA7: | 30.91 | |
| MA20: | 29.74 | |
| MA50: | 28.11 | |
| MA100: | 26.97 | |
| MAexp7: | 30.86 | |
| MAexp20: | 30.97 | |
| MAexp50: | 30.96 | |
| MAexp100: | 30.62 | |
| Price / MA7: | -0.42% | |
| Price / MA20: | +3.50% | |
| Price / MA50: | +9.50% | |
| Price / MA100: | +14.13% | |
| Price / MAexp7: | -0.26% | |
| Price / MAexp20: | -0.61% | |
| Price / MAexp50: | -0.58% | |
| Price / MAexp100: | +0.52% |
News
Don't forget to follow the news on IMERYS. At the time of publication of this analysis, the latest news was as follows:
- Imerys Enters Long-Term Partnership with TotalEnergies for Renewable Power at its Santa Barbara County Facility
- TotalEnergies ENEOS Signs Solar Rooftop Project With Imerys, a world's leading supplier of mineral-based specialty solutions
- Imerys to Sell its Sahuarita Arizona Operation to Cimbar Performance Minerals
- IMERYS RELEASES NEW PRODUCT: ImerShield™ Flame Retardants
- Lomiko Metals Neighbour, Multinational Conglomerate Imerys Carbon & Graphite, Adds New Graphite Battery Product and Increase Prices for 2020
About author

Online


Add a comment
Comments
0 comments on the analysis IMERYS - 1H