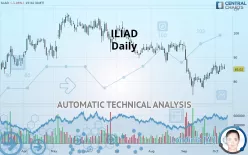
ILIAD - Daily - Technical analysis published on 10/09/2019 (GMT)
- 338
- 0
- Who voted?
Click here for a new analysis!
- Timeframe : Daily
- - Analysis generated on
- Status : TARGET REACHED

Summary of the analysis
Additional analysis
Quotes
The ILIAD price is 85.02 EUR. On the day, this instrument lost -1.05% with the lowest point at 84.98 EUR and the highest point at 87.08 EUR. The deviation from the price is +0.05% for the low point and -2.37% for the high point.The Central Gaps scanner detects a bullish opening marking the presence of buyers ahead of sellers at the opening but not sufficiently marked to allow the price to register a quotation gap.
Bullish opening
Type : Bullish
Timeframe : Openning
So that you have an overall view of the price change, here is a table showing the variations over several periods:
Near a new HIGH record (1 month)
Type : Bullish
Timeframe : Weekly
Technical
A technical analysis in Daily of this ILIAD chart shows a bearish trend. 71.43% of the signals given by moving averages are bearish. Caution: the neutral signals currently given by short-term moving averages show us that the global trend is losing momentum. There is no crossing of moving average by the price or crossing of moving averages between themselves.
In fact, according to the parameters integrated into the Central Analyzer system, only 8 technical indicators out of 18 analysed are currently bullish. But beware of excesses. The Central Indicators scanner currently detects this:
CCI indicator: bearish divergence
Type : Bearish
Timeframe : Daily
MACD indicator: bearish divergence
Type : Bearish
Timeframe : Daily
Ichimoku - Bullish crossover : Tenkan & Kijun
Type : Bullish
Timeframe : Daily
Price is back over the pivot point
Type : Bullish
Timeframe : Weekly
An analysis of the price chart with the Central Patterns scanner (detector of chart patterns and resistances and supports) shows several results that can have an impact on the price change:
Near horizontal resistance
Type : Bearish
Timeframe : Daily
Resistance of channel is broken
Type : Bullish
Timeframe : Daily
The Central Candlesticks scanner, specialised in Japanese candlesticks, did not identify any signals.
| S3 | S2 | S1 | Price | R1 | R2 | R3 | |
|---|---|---|---|---|---|---|---|
| ProTrendLines | 62.08 | 77.72 | 84.26 | 85.02 | 90.76 | 95.33 | 101.87 |
| Change (%) | -26.98% | -8.59% | -0.89% | - | +6.75% | +12.13% | +19.82% |
| Change | -22.94 | -7.30 | -0.76 | - | +5.74 | +10.31 | +16.85 |
| Level | Minor | Intermediate | Major | - | Minor | Intermediate | Minor |
Pivot points can also be used to set your price objectives. Here is the price situation in relation to pivot points:
| Pivot points | S3 | S2 | S1 | PP | R1 | R2 | R3 |
|---|---|---|---|---|---|---|---|
| Standard | 83.29 | 84.03 | 84.97 | 85.71 | 86.65 | 87.39 | 88.33 |
| Camarilla | 85.46 | 85.61 | 85.77 | 85.92 | 86.07 | 86.23 | 86.38 |
| Woodie | 83.40 | 84.08 | 85.08 | 85.76 | 86.76 | 87.44 | 88.44 |
| Fibonacci | 84.03 | 84.67 | 85.07 | 85.71 | 86.35 | 86.75 | 87.39 |
| Pivot points | S3 | S2 | S1 | PP | R1 | R2 | R3 |
|---|---|---|---|---|---|---|---|
| Standard | 78.07 | 80.47 | 83.23 | 85.63 | 88.39 | 90.79 | 93.55 |
| Camarilla | 84.56 | 85.03 | 85.51 | 85.98 | 86.45 | 86.93 | 87.40 |
| Woodie | 78.24 | 80.56 | 83.40 | 85.72 | 88.56 | 90.88 | 93.72 |
| Fibonacci | 80.47 | 82.44 | 83.66 | 85.63 | 87.60 | 88.82 | 90.79 |
| Pivot points | S3 | S2 | S1 | PP | R1 | R2 | R3 |
|---|---|---|---|---|---|---|---|
| Standard | 52.99 | 63.59 | 74.91 | 85.51 | 96.83 | 107.43 | 118.75 |
| Camarilla | 80.19 | 82.20 | 84.21 | 86.22 | 88.23 | 90.24 | 92.25 |
| Woodie | 53.34 | 63.77 | 75.26 | 85.69 | 97.18 | 107.61 | 119.10 |
| Fibonacci | 63.59 | 71.97 | 77.14 | 85.51 | 93.89 | 99.06 | 107.43 |
Numerical data
The following is the status of technical indicators and moving averages registered at the time this technical analysis was created:
| RSI (14): | 49.65 | |
| MACD (12,26,9): | -0.3700 | |
| Directional Movement: | 5.52 | |
| AROON (14): | 57.14 | |
| DEMA (21): | 83.68 | |
| Parabolic SAR (0,02-0,02-0,2): | 84.18 | |
| Elder Ray (13): | 1.40 | |
| Super Trend (3,10): | 88.06 | |
| Zig ZAG (10): | 85.02 | |
| VORTEX (21): | 1.2000 | |
| Stochastique (14,3,5): | 74.56 | |
| TEMA (21): | 85.19 | |
| Williams %R (14): | -38.82 | |
| Chande Momentum Oscillator (20): | 3.94 | |
| Repulse (5,40,3): | -1.3100 | |
| ROCnROLL: | -1 | |
| TRIX (15,9): | -0.2000 | |
| Courbe Coppock: | 12.24 |
| MA7: | 85.18 | |
| MA20: | 83.02 | |
| MA50: | 87.88 | |
| MA100: | 93.18 | |
| MAexp7: | 85.13 | |
| MAexp20: | 84.67 | |
| MAexp50: | 87.29 | |
| MAexp100: | 90.74 | |
| Price / MA7: | -0.19% | |
| Price / MA20: | +2.41% | |
| Price / MA50: | -3.25% | |
| Price / MA100: | -8.76% | |
| Price / MAexp7: | -0.13% | |
| Price / MAexp20: | +0.41% | |
| Price / MAexp50: | -2.60% | |
| Price / MAexp100: | -6.30% |
News
Don"t forget to follow the news on ILIAD. At the time of publication of this analysis, the latest news was as follows:
- Immunicum AB (publ) Announces Advancement to Next Dosage Group Level in Phase Ib/II ILIAD Combination Trial
- [Iliad Press Release] Iliad announces a partnership aimed at accelerating fiber rollouts outside very densely populated areas
- [Iliad Press Release] Iliad and Cellnex form a strategic partnership
- [Press Release] Iliad launches Up2Share, its first employee share offer
- [Iliad Press Release] Resignation of Olivier Rosenfeld, member of the Board of Directors
About author

Online


Add a comment
Comments
0 comments on the analysis ILIAD - Daily