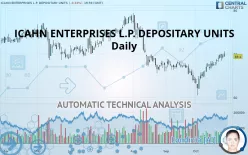
ICAHN ENTERPRISES L.P. DEPOSITARY UNITS - Daily - Technical analysis published on 10/28/2019 (GMT)
- 371
- 0
Click here for a new analysis!
- Timeframe : Daily
- - Analysis generated on
- Status : INVALID

Summary of the analysis

Additional analysis
Quotes
The ICAHN ENTERPRISES L.P. DEPOSITARY UNITS rating is 69.40 USD. The price registered a decrease of -0.33% on the session and was traded between 69.30 USD and 70.63 USD over the period. The price is currently at +0.14% from its lowest and -1.74% from its highest.The Central Gaps scanner detects the formation of a bullish gap marking the strong presence of buyers against sellers at the opening. This formed a quotation gap.
Opening Gap UP
Type : Bullish
Timeframe : Openning
Here is a more detailed summary of the historical variations registered by ICAHN ENTERPRISES L.P. DEPOSITARY UNITS:
Technical
A technical analysis in Daily of this ICAHN ENTERPRISES L.P. DEPOSITARY UNITS chart shows a slightly bullish trend. 57.14% of the signals given by moving averages are bullish. The overall trend could accelerate as strong bullish signals from short-term moving averages are expected. The Central Indicators scanner detects bullish signals on moving averages that could impact this trend:
Bullish trend reversal : Moving Average 50
Type : Bullish
Timeframe : Daily
Bullish price crossover with Moving Average 100
Type : Bullish
Timeframe : Daily
Bullish price crossover with adaptative moving average 100
Type : Bullish
Timeframe : Daily
In fact, according to the parameters integrated into the Central Analyzer system, 12 technical indicators out of 18 analysed are currently bullish. Caution: the Central Indicators scanner currently detects an excess:
CCI indicator is overbought : over 100
Type : Neutral
Timeframe : Daily
Williams %R indicator is overbought : over -20
Type : Neutral
Timeframe : Daily
Price is back over the pivot point
Type : Bullish
Timeframe : Daily
Price is back over the pivot point
Type : Bullish
Timeframe : Weekly
The Central Patterns scanner, which studies chart patterns, resistances and supports, has identified these signals:
Near horizontal resistance
Type : Bearish
Timeframe : Daily
Resistance of channel is broken
Type : Bullish
Timeframe : Daily
Central Candlesticks, the scanner specialised in Japanese candlesticks, detects a bullish signal that could support the hypothesis of a small rebound in the very short term:
Bullish harami
Type : Bullish
Timeframe : Daily
| S3 | S2 | S1 | Price | R1 | R2 | R3 | |
|---|---|---|---|---|---|---|---|
| ProTrendLines | 63.47 | 66.41 | 69.08 | 69.40 | 72.40 | 74.38 | 78.54 |
| Change (%) | -8.54% | -4.31% | -0.46% | - | +4.32% | +7.18% | +13.17% |
| Change | -5.93 | -2.99 | -0.32 | - | +3.00 | +4.98 | +9.14 |
| Level | Major | Minor | Major | - | Minor | Intermediate | Intermediate |
Attention could also be paid to pivot points to set price objectives:
| Pivot points | S3 | S2 | S1 | PP | R1 | R2 | R3 |
|---|---|---|---|---|---|---|---|
| Standard | 68.00 | 68.45 | 69.04 | 69.49 | 70.08 | 70.53 | 71.12 |
| Camarilla | 69.34 | 69.44 | 69.54 | 69.63 | 69.73 | 69.82 | 69.92 |
| Woodie | 68.07 | 68.49 | 69.11 | 69.53 | 70.15 | 70.57 | 71.19 |
| Fibonacci | 68.45 | 68.85 | 69.09 | 69.49 | 69.89 | 70.13 | 70.53 |
| Pivot points | S3 | S2 | S1 | PP | R1 | R2 | R3 |
|---|---|---|---|---|---|---|---|
| Standard | 65.70 | 66.64 | 68.13 | 69.07 | 70.56 | 71.50 | 72.99 |
| Camarilla | 68.96 | 69.19 | 69.41 | 69.63 | 69.85 | 70.08 | 70.30 |
| Woodie | 65.99 | 66.78 | 68.42 | 69.21 | 70.85 | 71.64 | 73.28 |
| Fibonacci | 66.64 | 67.57 | 68.14 | 69.07 | 70.00 | 70.57 | 71.50 |
| Pivot points | S3 | S2 | S1 | PP | R1 | R2 | R3 |
|---|---|---|---|---|---|---|---|
| Standard | 56.41 | 59.82 | 62.01 | 65.43 | 67.62 | 71.03 | 73.22 |
| Camarilla | 62.66 | 63.17 | 63.69 | 64.20 | 64.71 | 65.23 | 65.74 |
| Woodie | 55.80 | 59.52 | 61.40 | 65.12 | 67.00 | 70.72 | 72.61 |
| Fibonacci | 59.82 | 61.97 | 63.29 | 65.43 | 67.57 | 68.89 | 71.03 |
Numerical data
The following are the details of the technical indicators and moving averages that were collected to generate this technical analysis:
| RSI (14): | 62.80 | |
| MACD (12,26,9): | 0.7700 | |
| Directional Movement: | 8.59 | |
| AROON (14): | 100.00 | |
| DEMA (21): | 68.53 | |
| Parabolic SAR (0,02-0,02-0,2): | 68.34 | |
| Elder Ray (13): | 1.70 | |
| Super Trend (3,10): | 65.97 | |
| Zig ZAG (10): | 69.40 | |
| VORTEX (21): | 1.1700 | |
| Stochastique (14,3,5): | 85.56 | |
| TEMA (21): | 69.66 | |
| Williams %R (14): | -20.91 | |
| Chande Momentum Oscillator (20): | 2.40 | |
| Repulse (5,40,3): | -1.0500 | |
| ROCnROLL: | 1 | |
| TRIX (15,9): | 0.0800 | |
| Courbe Coppock: | 11.99 |
| MA7: | 69.03 | |
| MA20: | 66.92 | |
| MA50: | 66.99 | |
| MA100: | 69.40 | |
| MAexp7: | 68.95 | |
| MAexp20: | 67.77 | |
| MAexp50: | 67.78 | |
| MAexp100: | 68.29 | |
| Price / MA7: | +0.54% | |
| Price / MA20: | +3.71% | |
| Price / MA50: | +3.60% | |
| Price / MA100: | -0% | |
| Price / MAexp7: | +0.65% | |
| Price / MAexp20: | +2.41% | |
| Price / MAexp50: | +2.39% | |
| Price / MAexp100: | +1.63% |
News
The last news published on ICAHN ENTERPRISES L.P. DEPOSITARY UNITS at the time of the generation of this analysis was as follows:
- UPDATE - New York City Icahn School of Medicine at Mount Sinai and Renowned Global Researcher Dr. Hurd, Select MediPharm Labs to Support 500 Patient Major Clinical Study And “CBD International Consortium” to Develop Treatment of Opioid Addiction
- Mount Sinai Icahn School of Medicine’s Dr. Robert S. Rosenson Receives Foundation of the National Lipid Association 2019 Clinician/Educator Award
-
 What Activist Investor Icahn Reportedly Did With All His Lyft Shares Before IPO
- Voltari Corporation Enters Into Definitive Merger Agreement to be Acquired by Affiliate of Carl C. Icahn for $0.86 per Share in Cash
- Icahn Automotive Announces 'Race to 2026' Program to Address Service Technician Shortage Facing the Automotive Industry
About author

Online


Add a comment
Comments
0 comments on the analysis ICAHN ENTERPRISES L.P. DEPOSITARY UNITS - Daily