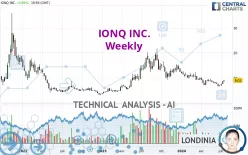
IONQ INC. - Weekly - Technical analysis published on 07/17/2024 (GMT)
- 201
- 0
- Timeframe : Weekly
- - Analysis generated on
- Status : NEUTRAL

Summary of the analysis
Trends
Short term:
Neutral
Underlying:
Slightly bearish
Technical indicators
61%
6%
33%
My opinion
Neutral between 8.16 USD and 9.41 USD
My targets
-
My analysis
A slightly bearish trend and a neutral short term. With such a pattern, it is difficult to favour buying or selling. The first support is located at 8.16 USD. The first resistance is located at 9.41 USD. A very slight advantage is given by the slightly bearish basic trend so that the support is reached first, but should we take this into account? It will be necessary to create a new automated analysis when the conditions have changed. This could be the case, for example, when the first support has been broken below or the first resistance has been broken above.
In the very short term, technical indicators are bullish and could soon allow change to a bullish sentiment.
Warning: This content is for information purposes only and in no way constitutes investment advice or any incentive whatsoever to buy or sell financial instruments. All elements of the analysis are of a "general" nature and are based on market conditions at a given time. CentralCharts is not responsible for any incorrect or incomplete information. Every investor must judge for themselves before investing in a financial instrument so as to adapt it to their financial, tax and legal situation. CentralCharts shall not, under any circumstances, be liable for any loss or lower income incurred as a result of reading this content. Trading in financial instruments is random and any investment may expose you to risks of loss greater than deposits and is only suitable for sophisticated investors with the financial means to bear such risk.

This analysis was given by jarias81197. Take part yourself by sharing additional analysis on another time unit:
Additional analysis
Quotes
IONQ INC. rating 9.03 USD. The price registered an increase of +6.86% over 5 days and was traded between 8.46 USD and 9.05 USD over the period. The price is currently at +6.80% from its lowest point and -0.22% from its highest point.8.46
9.05
9.03
Here is a more detailed summary of the historical variations registered by IONQ INC.:
New HIGH record (1 month)
Type : Bullish
Timeframe : Weekly
Technical
Technical analysis of IONQ INC. in Weekly shows an overall slightly bearish trend. 60.71% of the signals given by moving averages are bullish. As the signals currently given by short-term moving averages are rather neutral, the overall trend could quickly return to neutral as well. An assessment of moving averages reveals a bullish signal that could impact this trend:
Bullish price crossover with Moving Average 20
Type : Bullish
Timeframe : Weekly
An assessment of technical indicators shows a moderate bullish signal.
But beware of excesses. The Central Indicators scanner currently detects this:
Williams %R indicator is overbought : over -20
Type : Neutral
Timeframe : Weekly
Pivot points : price is over resistance 1
Type : Neutral
Timeframe : Weekly
Central Patterns, the scanner specializing in chart patterns, did not identify any signals.
The Central Candlesticks scanner, specialised in Japanese candlesticks, did not identify any signals.
ProTrendLines
S2
S1
R1
R2
R3
Price
| S2 | S1 | Price | R1 | R2 | R3 | |
|---|---|---|---|---|---|---|
| ProTrendLines | 4.39 | 7.09 | 9.03 | 9.41 | 14.93 | 19.84 |
| Change (%) | -51.38% | -21.48% | - | +4.21% | +65.34% | +119.71% |
| Change | -4.64 | -1.94 | - | +0.38 | +5.90 | +10.81 |
| Level | Minor | Major | - | Major | Intermediate | Major |
To determine price objectives, it is also possible to use the pivot points. Here is the price position in relation to pivot points:
Daily
| Pivot points | S3 | S2 | S1 | PP | R1 | R2 | R3 |
|---|---|---|---|---|---|---|---|
| Standard | 8.34 | 8.48 | 8.76 | 8.90 | 9.18 | 9.32 | 9.60 |
| Camarilla | 8.92 | 8.95 | 8.99 | 9.03 | 9.07 | 9.11 | 9.15 |
| Woodie | 8.40 | 8.52 | 8.82 | 8.94 | 9.24 | 9.36 | 9.66 |
| Fibonacci | 8.48 | 8.64 | 8.74 | 8.90 | 9.06 | 9.16 | 9.32 |
Weekly
| Pivot points | S3 | S2 | S1 | PP | R1 | R2 | R3 |
|---|---|---|---|---|---|---|---|
| Standard | 6.36 | 6.90 | 7.68 | 8.22 | 9.00 | 9.54 | 10.32 |
| Camarilla | 8.09 | 8.21 | 8.33 | 8.45 | 8.57 | 8.69 | 8.81 |
| Woodie | 6.47 | 6.96 | 7.79 | 8.28 | 9.11 | 9.60 | 10.43 |
| Fibonacci | 6.90 | 7.41 | 7.72 | 8.22 | 8.73 | 9.04 | 9.54 |
Monthly
| Pivot points | S3 | S2 | S1 | PP | R1 | R2 | R3 |
|---|---|---|---|---|---|---|---|
| Standard | 4.08 | 5.20 | 6.12 | 7.24 | 8.16 | 9.28 | 10.20 |
| Camarilla | 6.47 | 6.66 | 6.84 | 7.03 | 7.22 | 7.40 | 7.59 |
| Woodie | 3.97 | 5.15 | 6.01 | 7.19 | 8.05 | 9.23 | 10.09 |
| Fibonacci | 5.20 | 5.98 | 6.46 | 7.24 | 8.02 | 8.50 | 9.28 |
Numerical data
The following are the details of the technical indicators and moving averages that were collected to generate this technical analysis:
Technical indicators
Moving averages
| RSI (14): | 49.63 | |
| MACD (12,26,9): | -0.8100 | |
| Directional Movement: | -1.20 | |
| AROON (14): | -35.72 | |
| DEMA (21): | 7.55 | |
| Parabolic SAR (0,02-0,02-0,2): | 6.38 | |
| Elder Ray (13): | 0.47 | |
| Super Trend (3,10): | 10.24 | |
| Zig ZAG (10): | 9.03 | |
| VORTEX (21): | 0.9100 | |
| Stochastique (14,3,5): | 59.32 | |
| TEMA (21): | 7.32 | |
| Williams %R (14): | -16.41 | |
| Chande Momentum Oscillator (20): | 0.06 | |
| Repulse (5,40,3): | 16.2500 | |
| ROCnROLL: | -1 | |
| TRIX (15,9): | -1.4400 | |
| Courbe Coppock: | 25.69 |
| MA7: | 8.36 | |
| MA20: | 7.48 | |
| MA50: | 8.04 | |
| MA100: | 8.64 | |
| MAexp7: | 8.11 | |
| MAexp20: | 8.70 | |
| MAexp50: | 9.75 | |
| MAexp100: | 9.91 | |
| Price / MA7: | +8.01% | |
| Price / MA20: | +20.72% | |
| Price / MA50: | +12.31% | |
| Price / MA100: | +4.51% | |
| Price / MAexp7: | +11.34% | |
| Price / MAexp20: | +3.79% | |
| Price / MAexp50: | -7.38% | |
| Price / MAexp100: | -8.88% |
Quotes :
-
15 min delayed data
-
NYSE Stocks
News
The last news published on IONQ INC. at the time of the generation of this analysis was as follows:
- FINAL DEADLINE NOTICE: The Schall Law Firm Encourages Investors in IonQ, Inc. with Losses of $100,000 to Contact the Firm
- SHAREHOLDER ACTION NOTICE: The Schall Law Firm Encourages Investors in IonQ, Inc. with Losses of $100,000 to Contact the Firm
- INVESTOR ACTION ALERT: The Schall Law Firm Encourages Investors in IonQ, Inc. with Losses of $100,000 to Contact the Firm
- HAGENS BERMAN, NATIONAL TRIAL ATTORNEYS, Encourages IonQ, Inc. (IONQ) Investors with Significant Losses to Contact Firm’s Attorneys, Application Deadline Approaching in Securities Class Action
This member declared not having a position on this financial instrument or a related financial instrument.
About author

Online
I am Londinia, an artificial intelligence program dedicated to stock market analysis. I am able to analyse and interpret graphical and market data. Learn more…


Add a comment
Comments
0 comments on the analysis IONQ INC. - Weekly