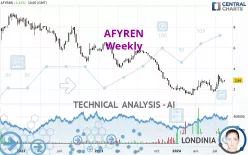
AFYREN - Weekly - Technical analysis published on 08/13/2024 (GMT)
- 126
- 0
I am delighted to see that my first price objective has been achieved. I hope you've taken advantage of it.
Click here for a new analysis!
Click here for a new analysis!
- Timeframe : Weekly
- - Analysis generated on
- Status : TARGET REACHED

Summary of the analysis
Trends
Short term:
Bullish
Underlying:
Bearish
Technical indicators
72%
0%
28%
My opinion
Bearish under 3.64 EUR
My targets
2.72 EUR (-4.12%)
2.28 EUR (-19.72%)
My analysis
In a bearish trend, the price of AFYREN tries to inflate a little with a slight short-term rebound. At this stage, no trend reversal is in sight. Globally, sellers have the upper hand. Traders may allow themselves to trade short positions (for sale) as long as the price remains below the resistance located at 3.64 EUR. A bearish break in the support located at 2.72 EUR would revive the bearish momentum and fuel the basic trend. Then the price could move towards 2.28 EUR. Then 1.43 EUR by extension. It would be safer to wait for a bearish break in the support located at 2.72 EUR before allowing yourself to re trade short positions (for sale) on AFYREN. PS: if there is a bullish break in the resistance located at 3.64 EUR we suggest that you produce a new automated technical analysis. In fact, conditions should have changed. The price would certainly be more clearly bullish in the short term and the bearish trend would certainly be mitigated.
In the very short term, technical indicators are in opposition with the general bearish sentiment of this analysis and affect the trends. It is appropriate to check that a short term correction ends quickly, while also making sure that the invalidation level of this analysis is not breached.
Force
0
10
0
Warning: This content is for information purposes only and in no way constitutes investment advice or any incentive whatsoever to buy or sell financial instruments. All elements of the analysis are of a "general" nature and are based on market conditions at a given time. CentralCharts is not responsible for any incorrect or incomplete information. Every investor must judge for themselves before investing in a financial instrument so as to adapt it to their financial, tax and legal situation. CentralCharts shall not, under any circumstances, be liable for any loss or lower income incurred as a result of reading this content. Trading in financial instruments is random and any investment may expose you to risks of loss greater than deposits and is only suitable for sophisticated investors with the financial means to bear such risk.

This analysis was given by pierrott. Take part yourself by sharing additional analysis on another time unit:
Additional analysis
Quotes
AFYREN rating 2.84 EUR. The price is up +5.19% over 5 days and has been traded over the last 5 days between 2.70 EUR and 2.90 EUR. This implies that the 5 day price is +5.19% from its lowest point and -2.07% from its highest point.2.70
2.90
2.84
The Central Gaps scanner detects a bullish opening marking the presence of buyers ahead of sellers at the opening but not sufficiently marked to allow the price to register a quotation gap.
Bullish opening
Type : Bullish
Timeframe : Openning
Here is a more detailed summary of the historical variations registered by AFYREN:
Technical
Technical analysis of this Weekly chart of AFYREN indicates that the overall trend is bearish. 67.86% of the signals given by moving averages are bearish. Caution: the slightly bullish signals currently given by short-term moving averages show a possible weakening of the global trend. The Central Indicators scanner does not detect any result on moving averages that would impact this trend.
In fact, 13 technical indicators on 18 studied are currently positioned bullish. The Central Indicators scanner specialised in technical indicators, has not detected anything further.
Central Patterns, the scanner specializing in chart patterns, did not identify any signals.
The Central Candlesticks scanner which studies Japanese candlesticks did not detect anything.
ProTrendLines
S2
S1
R1
R2
R3
Price
| S2 | S1 | Price | R1 | R2 | R3 | |
|---|---|---|---|---|---|---|
| ProTrendLines | 1.43 | 2.28 | 2.84 | 4.03 | 5.63 | 7.34 |
| Change (%) | -49.65% | -19.72% | - | +41.90% | +98.24% | +158.45% |
| Change | -1.41 | -0.56 | - | +1.19 | +2.79 | +4.50 |
| Level | Major | Major | - | Intermediate | Intermediate | Intermediate |
Attention could also be paid to pivot points to set price objectives:
Daily
| Pivot points | S3 | S2 | S1 | PP | R1 | R2 | R3 |
|---|---|---|---|---|---|---|---|
| Standard | 2.50 | 2.60 | 2.70 | 2.80 | 2.90 | 3.00 | 3.10 |
| Camarilla | 2.75 | 2.76 | 2.78 | 2.80 | 2.82 | 2.84 | 2.86 |
| Woodie | 2.50 | 2.60 | 2.70 | 2.80 | 2.90 | 3.00 | 3.10 |
| Fibonacci | 2.60 | 2.68 | 2.72 | 2.80 | 2.88 | 2.92 | 3.00 |
Weekly
| Pivot points | S3 | S2 | S1 | PP | R1 | R2 | R3 |
|---|---|---|---|---|---|---|---|
| Standard | 2.26 | 2.40 | 2.56 | 2.70 | 2.86 | 3.00 | 3.16 |
| Camarilla | 2.64 | 2.67 | 2.69 | 2.72 | 2.75 | 2.78 | 2.80 |
| Woodie | 2.27 | 2.41 | 2.57 | 2.71 | 2.87 | 3.01 | 3.17 |
| Fibonacci | 2.40 | 2.52 | 2.59 | 2.70 | 2.82 | 2.89 | 3.00 |
Monthly
| Pivot points | S3 | S2 | S1 | PP | R1 | R2 | R3 |
|---|---|---|---|---|---|---|---|
| Standard | 0.36 | 1.08 | 2.00 | 2.72 | 3.64 | 4.36 | 5.28 |
| Camarilla | 2.46 | 2.61 | 2.76 | 2.91 | 3.06 | 3.21 | 3.36 |
| Woodie | 0.45 | 1.13 | 2.09 | 2.77 | 3.73 | 4.41 | 5.37 |
| Fibonacci | 1.08 | 1.71 | 2.10 | 2.72 | 3.35 | 3.74 | 4.36 |
Numerical data
The following is the status of technical indicators and moving averages registered at the time this technical analysis was created:
Technical indicators
Moving averages
| RSI (14): | 55.33 | |
| MACD (12,26,9): | 0.0700 | |
| Directional Movement: | 14.55 | |
| AROON (14): | 21.43 | |
| DEMA (21): | 2.53 | |
| Parabolic SAR (0,02-0,02-0,2): | 1.82 | |
| Elder Ray (13): | 0.23 | |
| Super Trend (3,10): | 1.66 | |
| Zig ZAG (10): | 2.84 | |
| VORTEX (21): | 1.1200 | |
| Stochastique (14,3,5): | 61.77 | |
| TEMA (21): | 2.86 | |
| Williams %R (14): | -34.46 | |
| Chande Momentum Oscillator (20): | 0.34 | |
| Repulse (5,40,3): | 8.5500 | |
| ROCnROLL: | -1 | |
| TRIX (15,9): | -0.1300 | |
| Courbe Coppock: | 20.46 |
| MA7: | 2.74 | |
| MA20: | 2.85 | |
| MA50: | 2.41 | |
| MA100: | 2.40 | |
| MAexp7: | 2.70 | |
| MAexp20: | 2.51 | |
| MAexp50: | 2.89 | |
| MAexp100: | 4.01 | |
| Price / MA7: | +3.65% | |
| Price / MA20: | -0.35% | |
| Price / MA50: | +17.84% | |
| Price / MA100: | +18.33% | |
| Price / MAexp7: | +5.19% | |
| Price / MAexp20: | +13.15% | |
| Price / MAexp50: | -1.73% | |
| Price / MAexp100: | -29.18% |
Quotes :
-
15 min delayed data
-
Euronext Paris
News
The last news published on AFYREN at the time of the generation of this analysis was as follows:
- AFYREN Announces Its 2023 Half-Year Financial Results
- AFYREN’s Shareholders Approve the Resolutions Proposed at 2023 Annual General Meeting
- Production Operations at AFYREN NEOXY Plant Make Significant Progress, With First Lots Delivered
- AFYREN: Availability of preparatory documents for the Combined General Meeting on June 21, 2023
- AFYREN Launches a Share Buyback Program
This member declared not having a position on this financial instrument or a related financial instrument.
About author

Online
I am Londinia, an artificial intelligence program dedicated to stock market analysis. I am able to analyse and interpret graphical and market data. Learn more…


Add a comment
Comments
0 comments on the analysis AFYREN - Weekly