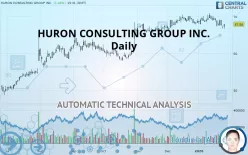
HURON CONSULTING GROUP INC. - Daily - Technical analysis published on 01/28/2020 (GMT)
- 211
- 0
- Who voted?
- Timeframe : Daily
- - Analysis generated on
- Status : NEUTRAL

Summary of the analysis

Additional analysis
Quotes
The HURON CONSULTING GROUP INC. price is 67.88 USD. The price registered an increase of +1.47% on the session and was traded between 66.64 USD and 67.95 USD over the period. The price is currently at +1.86% from its lowest and -0.10% from its highest.The Central Gaps scanner detects a bullish opening marking the presence of buyers ahead of sellers at the opening but not sufficiently marked to allow the price to register a quotation gap.
Bullish opening
Type : Bullish
Timeframe : Openning
So that you have an overall view of the price change, here is a table showing the variations over several periods:
Near a new LOW record (1st january)
Type : Bearish
Timeframe : Weekly
Near a new LOW record (1 month)
Type : Bearish
Timeframe : Weekly
Technical
A technical analysis in Daily of this HURON CONSULTING GROUP INC. chart shows a slightly bullish trend. 60.71% of the signals given by moving averages are bullish. Caution: the slightly bearish signals currently given by short-term moving averages indicate that the overall trend could be reversed. An assessment of moving averages reveals a bearish signal that could impact this trend:
Bearish price crossover with adaptative moving average 100
Type : Bearish
Timeframe : Daily
The technical indicators are generally neutral. They do not provide relevant information on the direction of future price movements.
Caution: the Central Indicators scanner currently detects an excess:
CCI indicator is oversold : under -100
Type : Neutral
Timeframe : Daily
Williams %R indicator is oversold : under -80
Type : Neutral
Timeframe : Daily
MACD indicator is back under 0
Type : Bearish
Timeframe : Daily
Ichimoku - Bearish crossover : Tenkan & Kijun
Type : Bearish
Timeframe : Daily
Price is back under the pivot point
Type : Bearish
Timeframe : Weekly
No signals are given by Central Patterns, a market scanner specialised in chart patterns, resistances and supports.
Central Candlesticks, the scanner specialised in Japanese candlesticks, detects this inversion signal that could impact the current short-term trend:
Doji
Type : Neutral
Timeframe : Daily
| S3 | S2 | S1 | Price | R1 | R2 | R3 | |
|---|---|---|---|---|---|---|---|
| ProTrendLines | 55.97 | 58.49 | 64.46 | 67.88 | 68.25 | 71.29 | 77.89 |
| Change (%) | -17.55% | -13.83% | -5.04% | - | +0.55% | +5.02% | +14.75% |
| Change | -11.91 | -9.39 | -3.42 | - | +0.37 | +3.41 | +10.01 |
| Level | Intermediate | Intermediate | Intermediate | - | Intermediate | Major | Major |
Pivot points can also be used to set your price objectives. Here is the price situation in relation to pivot points:
| Pivot points | S3 | S2 | S1 | PP | R1 | R2 | R3 |
|---|---|---|---|---|---|---|---|
| Standard | 66.08 | 66.47 | 66.68 | 67.07 | 67.28 | 67.67 | 67.88 |
| Camarilla | 66.74 | 66.79 | 66.85 | 66.90 | 66.96 | 67.01 | 67.07 |
| Woodie | 66.00 | 66.43 | 66.60 | 67.03 | 67.20 | 67.63 | 67.80 |
| Fibonacci | 66.47 | 66.70 | 66.84 | 67.07 | 67.30 | 67.44 | 67.67 |
| Pivot points | S3 | S2 | S1 | PP | R1 | R2 | R3 |
|---|---|---|---|---|---|---|---|
| Standard | 65.04 | 66.18 | 66.88 | 68.02 | 68.72 | 69.86 | 70.56 |
| Camarilla | 67.06 | 67.23 | 67.40 | 67.57 | 67.74 | 67.91 | 68.08 |
| Woodie | 64.81 | 66.07 | 66.65 | 67.91 | 68.49 | 69.75 | 70.33 |
| Fibonacci | 66.18 | 66.89 | 67.32 | 68.02 | 68.73 | 69.16 | 69.86 |
| Pivot points | S3 | S2 | S1 | PP | R1 | R2 | R3 |
|---|---|---|---|---|---|---|---|
| Standard | 61.98 | 64.04 | 66.38 | 68.44 | 70.78 | 72.84 | 75.18 |
| Camarilla | 67.51 | 67.91 | 68.32 | 68.72 | 69.12 | 69.53 | 69.93 |
| Woodie | 62.12 | 64.11 | 66.52 | 68.51 | 70.92 | 72.91 | 75.32 |
| Fibonacci | 64.04 | 65.72 | 66.76 | 68.44 | 70.12 | 71.16 | 72.84 |
Numerical data
The following is the status of technical indicators and moving averages registered at the time this technical analysis was created:
| RSI (14): | 42.75 | |
| MACD (12,26,9): | -0.1900 | |
| Directional Movement: | -0.20 | |
| AROON (14): | -64.29 | |
| DEMA (21): | 68.26 | |
| Parabolic SAR (0,02-0,02-0,2): | 70.12 | |
| Elder Ray (13): | -1.04 | |
| Super Trend (3,10): | 66.73 | |
| Zig ZAG (10): | 67.05 | |
| VORTEX (21): | 0.9200 | |
| Stochastique (14,3,5): | 4.29 | |
| TEMA (21): | 67.54 | |
| Williams %R (14): | -95.07 | |
| Chande Momentum Oscillator (20): | -1.71 | |
| Repulse (5,40,3): | -1.6600 | |
| ROCnROLL: | 2 | |
| TRIX (15,9): | 0.0200 | |
| Courbe Coppock: | 3.09 |
| MA7: | 67.82 | |
| MA20: | 68.65 | |
| MA50: | 68.18 | |
| MA100: | 65.13 | |
| MAexp7: | 67.75 | |
| MAexp20: | 68.36 | |
| MAexp50: | 67.58 | |
| MAexp100: | 65.08 | |
| Price / MA7: | +0.09% | |
| Price / MA20: | -1.12% | |
| Price / MA50: | -0.44% | |
| Price / MA100: | +4.22% | |
| Price / MAexp7: | +0.19% | |
| Price / MAexp20: | -0.70% | |
| Price / MAexp50: | +0.44% | |
| Price / MAexp100: | +4.30% |
News
The latest news and videos published on HURON CONSULTING GROUP INC. at the time of the analysis were as follows:
- Factors of Influence in 2019, Key Indicators and Opportunity within Leidos, Nomad Foods, Huron Consulting Group, Casella Waste, The Medicines, and Aurinia Pharmaceuticals — New Research Emphasizes Economic Growth
- Market Trends Toward New Normal in Mountain Province Diamonds, Marin Software, Ferroglobe, Apollo Endosurgery, Huron Consulting Group, and Chipmos Technologies — Emerging Consolidated Expectations, Analyst Ratings
-
 Huron Consulting Group
About author

Online


Add a comment
Comments
0 comments on the analysis HURON CONSULTING GROUP INC. - Daily