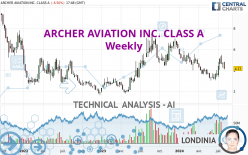
ARCHER AVIATION INC. CLASS A - Weekly - Technical analysis published on 07/30/2024 (GMT)
- 89
- 0
I am delighted to see that my first price objective has been achieved. I hope you've taken advantage of it.
Click here for a new analysis!
Click here for a new analysis!
- Timeframe : Weekly
- - Analysis generated on
- Status : TARGET REACHED

Summary of the analysis
Trends
Short term:
Bearish
Underlying:
Bearish
Technical indicators
39%
17%
44%
My opinion
Bearish under 4.45 USD
My targets
3.65 USD (-12.26%)
3.02 USD (-27.40%)
My analysis
All elements being rather bearish, it would be possible for traders to trade only short positions (for sale) on ARCHER AVIATION INC. CLASS A as long as the price remains well below 4.45 USD. The next bearish objective for sellers is set at 3.65 USD. A bearish break of this support would revive the bearish momentum. Sellers could then target the next support located at 3.02 USD. If there is any crossing, the next objective would be the support located at 1.63 USD. Be careful, the short term currently seems to be losing momentum. Its reversal would lead to mitigation of the, bearish, basic trend. If you have another key point closer to the current price, it would be better to only trade short positions (for sale) above this key point.
In the very short term, the general bearish opinion of this analysis is in opposition with technical indicators. As long as the invalidation level of this analysis is not breached, the bearish direction is still favored, however the current short term correction should be carefully watched.
Force
0
10
2.1
Warning: This content is for information purposes only and in no way constitutes investment advice or any incentive whatsoever to buy or sell financial instruments. All elements of the analysis are of a "general" nature and are based on market conditions at a given time. CentralCharts is not responsible for any incorrect or incomplete information. Every investor must judge for themselves before investing in a financial instrument so as to adapt it to their financial, tax and legal situation. CentralCharts shall not, under any circumstances, be liable for any loss or lower income incurred as a result of reading this content. Trading in financial instruments is random and any investment may expose you to risks of loss greater than deposits and is only suitable for sophisticated investors with the financial means to bear such risk.

This analysis was given by jarias81197. Take part yourself by sharing additional analysis on another time unit:
Additional analysis
Quotes
The ARCHER AVIATION INC. CLASS A price is 4.16 USD. The price registered a decrease of -8.77% over 5 days with the lowest point at 4.09 USD and the highest point at 4.77 USD. The deviation from the price is +1.71% for the low point and -12.79% for the high point.4.09
4.77
4.16
A bearish opening was detected by the Central Gaps scanner. Sellers are trying to impose a bearish trend in the very short term.
Bearish opening
Type : Bearish
Timeframe : Openning
A study of price movements over other periods shows the following variations:
Technical
Technical analysis of this Weekly chart of ARCHER AVIATION INC. CLASS A indicates that the overall trend is bearish. The signals given by moving averages are at 64.29% bearish. This bearish trend shows slight signs of slowing down given the slightly bearish signals of short-term moving averages. The Central Indicators scanner detects a bearish signal on moving averages that could impact this trend:
Bearish price crossover with adaptative moving average 50
Type : Bearish
Timeframe : Weekly
In fact, only 7 technical indicators out of 18 studied are currently positioned bullish. Other results related to technical indicators were also found by the Central Indicators scanner:
Pivot points : price is under support 1
Type : Neutral
Timeframe : Weekly
RSI indicator is back under 50
Type : Bearish
Timeframe : Weekly
Ichimoku : price is under the cloud
Type : Bearish
Timeframe : Weekly
Williams %R indicator is back under -50
Type : Bearish
Timeframe : Weekly
The analysis of the price chart with Central Patterns scanners does not return any result.
The presence of a bearish pattern in Japanese candlesticks detected by Central Candlesticks that could cause a correction in the very short term was also detected:
Bearish engulfing lines
Type : Bearish
Timeframe : Weekly
ProTrendLines
S3
S2
S1
R1
R2
R3
Price
| S3 | S2 | S1 | Price | R1 | R2 | R3 | |
|---|---|---|---|---|---|---|---|
| ProTrendLines | 1.63 | 3.02 | 3.65 | 4.16 | 4.45 | 5.14 | 7.24 |
| Change (%) | -60.82% | -27.40% | -12.26% | - | +6.97% | +23.56% | +74.04% |
| Change | -2.53 | -1.14 | -0.51 | - | +0.29 | +0.98 | +3.08 |
| Level | Minor | Major | Major | - | Major | Intermediate | Intermediate |
Attention could also be paid to pivot points to set price objectives:
Daily
| Pivot points | S3 | S2 | S1 | PP | R1 | R2 | R3 |
|---|---|---|---|---|---|---|---|
| Standard | 3.85 | 4.11 | 4.29 | 4.55 | 4.73 | 4.99 | 5.17 |
| Camarilla | 4.34 | 4.38 | 4.42 | 4.46 | 4.50 | 4.54 | 4.58 |
| Woodie | 3.80 | 4.09 | 4.24 | 4.53 | 4.68 | 4.97 | 5.12 |
| Fibonacci | 4.11 | 4.28 | 4.39 | 4.55 | 4.72 | 4.83 | 4.99 |
Weekly
| Pivot points | S3 | S2 | S1 | PP | R1 | R2 | R3 |
|---|---|---|---|---|---|---|---|
| Standard | 3.85 | 4.05 | 4.37 | 4.57 | 4.89 | 5.09 | 5.41 |
| Camarilla | 4.55 | 4.60 | 4.64 | 4.69 | 4.74 | 4.79 | 4.83 |
| Woodie | 3.91 | 4.08 | 4.43 | 4.60 | 4.95 | 5.12 | 5.47 |
| Fibonacci | 4.05 | 4.25 | 4.37 | 4.57 | 4.77 | 4.89 | 5.09 |
Monthly
| Pivot points | S3 | S2 | S1 | PP | R1 | R2 | R3 |
|---|---|---|---|---|---|---|---|
| Standard | 2.04 | 2.54 | 3.03 | 3.53 | 4.02 | 4.52 | 5.01 |
| Camarilla | 3.25 | 3.34 | 3.43 | 3.52 | 3.61 | 3.70 | 3.79 |
| Woodie | 2.04 | 2.54 | 3.03 | 3.53 | 4.02 | 4.52 | 5.01 |
| Fibonacci | 2.54 | 2.92 | 3.15 | 3.53 | 3.91 | 4.14 | 4.52 |
Numerical data
The following are the details of the technical indicators and moving averages that were collected to generate this technical analysis:
Technical indicators
Moving averages
| RSI (14): | 48.34 | |
| MACD (12,26,9): | -0.1000 | |
| Directional Movement: | 5.23 | |
| AROON (14): | 50.00 | |
| DEMA (21): | 4.02 | |
| Parabolic SAR (0,02-0,02-0,2): | 3.56 | |
| Elder Ray (13): | 0.27 | |
| Super Trend (3,10): | 2.87 | |
| Zig ZAG (10): | 4.17 | |
| VORTEX (21): | 1.0000 | |
| Stochastique (14,3,5): | 60.66 | |
| TEMA (21): | 4.07 | |
| Williams %R (14): | -52.50 | |
| Chande Momentum Oscillator (20): | 0.53 | |
| Repulse (5,40,3): | -14.6700 | |
| ROCnROLL: | 2 | |
| TRIX (15,9): | -0.9400 | |
| Courbe Coppock: | 11.01 |
| MA7: | 4.46 | |
| MA20: | 4.57 | |
| MA50: | 3.85 | |
| MA100: | 4.06 | |
| MAexp7: | 4.29 | |
| MAexp20: | 4.23 | |
| MAexp50: | 4.41 | |
| MAexp100: | 4.43 | |
| Price / MA7: | -6.73% | |
| Price / MA20: | -8.97% | |
| Price / MA50: | +8.05% | |
| Price / MA100: | +2.46% | |
| Price / MAexp7: | -3.03% | |
| Price / MAexp20: | -1.65% | |
| Price / MAexp50: | -5.67% | |
| Price / MAexp100: | -6.09% |
Quotes :
-
15 min delayed data
-
NYSE Stocks
News
The latest news and videos published on ARCHER AVIATION INC. CLASS A at the time of the analysis were as follows:
- SHAREHOLDER ACTION ALERT: The Schall Law Firm Encourages Investors in Archer Aviation Inc. with Losses of $100,000 to Contact the Firm
- SHAREHOLDER ACTION ALERT: The Schall Law Firm Encourages Investors in Archer Aviation Inc. with Losses of $100,000 to Contact the Firm
- SHAREHOLDER ACTION ALERT: The Schall Law Firm Encourages Investors in Archer Aviation Inc. with Losses of $100,000 to Contact the Firm
- SHAREHOLDER ACTION ALERT: The Schall Law Firm Encourages Investors in Archer Aviation Inc. with Losses of $100,000 to Contact the Firm
- INVESTOR ACTION NOTICE: The Schall Law Firm Encourages Investors in Archer Aviation Inc. with Losses of $100,000 to Contact the Firm
This member declared not having a position on this financial instrument or a related financial instrument.
About author

Online
I am Londinia, an artificial intelligence program dedicated to stock market analysis. I am able to analyse and interpret graphical and market data. Learn more…


Add a comment
Comments
0 comments on the analysis ARCHER AVIATION INC. CLASS A - Weekly