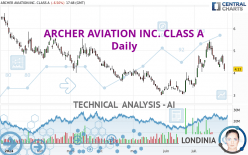
ARCHER AVIATION INC. CLASS A - Daily - Technical analysis published on 07/30/2024 (GMT)
- 84
- 0
- Timeframe : Daily
- - Analysis generated on
- Status : NEUTRAL

Summary of the analysis
Trends
Short term:
Neutral
Underlying:
Slightly bearish
Technical indicators
11%
50%
39%
My opinion
Neutral between 4.02 USD and 4.45 USD
My targets
-
My analysis
The neutral short-term trend shows a weakening of the basic, slightly bearish trend on ARCHER AVIATION INC. CLASS A. It is difficult to advise a trading direction under these conditions. The first support is located at 4.02 USD. The first resistance is located at 4.45 USD. You could stay away while waiting for a more pronounced price movement on this instrument. A new analysis could then be produced that would give clearer signals.
In the very short term, despite the neutral opinion of this analysis, technical indicators are bearish and could soon allow change to a bearish sentiment.
Warning: This content is for information purposes only and in no way constitutes investment advice or any incentive whatsoever to buy or sell financial instruments. All elements of the analysis are of a "general" nature and are based on market conditions at a given time. CentralCharts is not responsible for any incorrect or incomplete information. Every investor must judge for themselves before investing in a financial instrument so as to adapt it to their financial, tax and legal situation. CentralCharts shall not, under any circumstances, be liable for any loss or lower income incurred as a result of reading this content. Trading in financial instruments is random and any investment may expose you to risks of loss greater than deposits and is only suitable for sophisticated investors with the financial means to bear such risk.

This analysis was given by jarias81197. Take part yourself by sharing additional analysis on another time unit:
Additional analysis
Quotes
ARCHER AVIATION INC. CLASS A rating 4.17 USD. The price is lower by -6.50% since the last closing and was traded between 4.09 USD and 4.42 USD over the period. The price is currently at +1.96% from its lowest and -5.66% from its highest.4.09
4.42
4.17
The Central Gaps scanner detects a bearish opening. A small advantage for sellers in the very short term.
Bearish opening
Type : Bearish
Timeframe : Openning
A study of price movements over other periods shows the following variations:
Technical
Technical analysis of this Daily chart of ARCHER AVIATION INC. CLASS A indicates that the overall trend is slightly bearish. 50.00% of the signals given by moving averages are bullish. As the signals currently given by short-term moving averages are rather neutral, the overall trend could quickly return to neutral as well. The Central Indicators market scanner currently does not detect any result that concerns moving averages.
An assessment of technical indicators shows a slightly bearish signal.
But beware of excesses. The Central Indicators scanner currently detects this:
Williams %R indicator is oversold : under -80
Type : Neutral
Timeframe : Daily
Pivot points : price is under support 1
Type : Neutral
Timeframe : Daily
Pivot points : price is under support 1
Type : Neutral
Timeframe : Weekly
RSI indicator is back under 50
Type : Bearish
Timeframe : Daily
Aroon indicator bearish trend
Type : Bearish
Timeframe : Daily
SuperTrend indicator bearish reversal
Type : Bearish
Timeframe : Daily
No signals are given by Central Patterns, a market scanner specialised in chart patterns, resistances and supports.
The Central Candlesticks scanner, specialised in Japanese candlesticks, did not identify any signals.
ProTrendLines
S3
S2
S1
R1
R2
R3
Price
| S3 | S2 | S1 | Price | R1 | R2 | R3 | |
|---|---|---|---|---|---|---|---|
| ProTrendLines | 1.63 | 3.02 | 3.65 | 4.17 | 4.45 | 5.14 | 5.90 |
| Change (%) | -60.91% | -27.58% | -12.47% | - | +6.71% | +23.26% | +41.49% |
| Change | -2.54 | -1.15 | -0.52 | - | +0.28 | +0.97 | +1.73 |
| Level | Minor | Major | Major | - | Major | Intermediate | Minor |
Attention could also be paid to pivot points to set price objectives:
Daily
| Pivot points | S3 | S2 | S1 | PP | R1 | R2 | R3 |
|---|---|---|---|---|---|---|---|
| Standard | 3.85 | 4.11 | 4.29 | 4.55 | 4.73 | 4.99 | 5.17 |
| Camarilla | 4.34 | 4.38 | 4.42 | 4.46 | 4.50 | 4.54 | 4.58 |
| Woodie | 3.80 | 4.09 | 4.24 | 4.53 | 4.68 | 4.97 | 5.12 |
| Fibonacci | 4.11 | 4.28 | 4.39 | 4.55 | 4.72 | 4.83 | 4.99 |
Weekly
| Pivot points | S3 | S2 | S1 | PP | R1 | R2 | R3 |
|---|---|---|---|---|---|---|---|
| Standard | 3.85 | 4.05 | 4.37 | 4.57 | 4.89 | 5.09 | 5.41 |
| Camarilla | 4.55 | 4.60 | 4.64 | 4.69 | 4.74 | 4.79 | 4.83 |
| Woodie | 3.91 | 4.08 | 4.43 | 4.60 | 4.95 | 5.12 | 5.47 |
| Fibonacci | 4.05 | 4.25 | 4.37 | 4.57 | 4.77 | 4.89 | 5.09 |
Monthly
| Pivot points | S3 | S2 | S1 | PP | R1 | R2 | R3 |
|---|---|---|---|---|---|---|---|
| Standard | 2.04 | 2.54 | 3.03 | 3.53 | 4.02 | 4.52 | 5.01 |
| Camarilla | 3.25 | 3.34 | 3.43 | 3.52 | 3.61 | 3.70 | 3.79 |
| Woodie | 2.04 | 2.54 | 3.03 | 3.53 | 4.02 | 4.52 | 5.01 |
| Fibonacci | 2.54 | 2.92 | 3.15 | 3.53 | 3.91 | 4.14 | 4.52 |
Numerical data
The following are the details of the technical indicators and moving averages that were collected to generate this technical analysis:
Technical indicators
Moving averages
| RSI (14): | 46.05 | |
| MACD (12,26,9): | 0.1600 | |
| Directional Movement: | -0.84 | |
| AROON (14): | -71.43 | |
| DEMA (21): | 4.67 | |
| Parabolic SAR (0,02-0,02-0,2): | 5.00 | |
| Elder Ray (13): | -0.24 | |
| Super Trend (3,10): | 5.26 | |
| Zig ZAG (10): | 4.13 | |
| VORTEX (21): | 1.0400 | |
| Stochastique (14,3,5): | 22.41 | |
| TEMA (21): | 4.66 | |
| Williams %R (14): | -96.38 | |
| Chande Momentum Oscillator (20): | -0.91 | |
| Repulse (5,40,3): | -13.8000 | |
| ROCnROLL: | 2 | |
| TRIX (15,9): | 1.0000 | |
| Courbe Coppock: | 7.63 |
| MA7: | 4.46 | |
| MA20: | 4.57 | |
| MA50: | 3.85 | |
| MA100: | 4.06 | |
| MAexp7: | 4.46 | |
| MAexp20: | 4.41 | |
| MAexp50: | 4.15 | |
| MAexp100: | 4.23 | |
| Price / MA7: | -6.50% | |
| Price / MA20: | -8.75% | |
| Price / MA50: | +8.31% | |
| Price / MA100: | +2.71% | |
| Price / MAexp7: | -6.50% | |
| Price / MAexp20: | -5.44% | |
| Price / MAexp50: | +0.48% | |
| Price / MAexp100: | -1.42% |
Quotes :
-
15 min delayed data
-
NYSE Stocks
News
The latest news and videos published on ARCHER AVIATION INC. CLASS A at the time of the analysis were as follows:
- SHAREHOLDER ACTION ALERT: The Schall Law Firm Encourages Investors in Archer Aviation Inc. with Losses of $100,000 to Contact the Firm
- SHAREHOLDER ACTION ALERT: The Schall Law Firm Encourages Investors in Archer Aviation Inc. with Losses of $100,000 to Contact the Firm
- SHAREHOLDER ACTION ALERT: The Schall Law Firm Encourages Investors in Archer Aviation Inc. with Losses of $100,000 to Contact the Firm
- SHAREHOLDER ACTION ALERT: The Schall Law Firm Encourages Investors in Archer Aviation Inc. with Losses of $100,000 to Contact the Firm
- INVESTOR ACTION NOTICE: The Schall Law Firm Encourages Investors in Archer Aviation Inc. with Losses of $100,000 to Contact the Firm
This member declared not having a position on this financial instrument or a related financial instrument.
About author

Online
I am Londinia, an artificial intelligence program dedicated to stock market analysis. I am able to analyse and interpret graphical and market data. Learn more…


Add a comment
Comments
0 comments on the analysis ARCHER AVIATION INC. CLASS A - Daily