ARCHER AVIATION INC. CLASS A - Daily - Technical analysis published on 07/17/2024 (GMT)
- 86
- 0
Click here for a new analysis!
- Timeframe : Daily
- - Analysis generated on
- Status : INVALID
Summary of the analysis

Additional analysis
Quotes
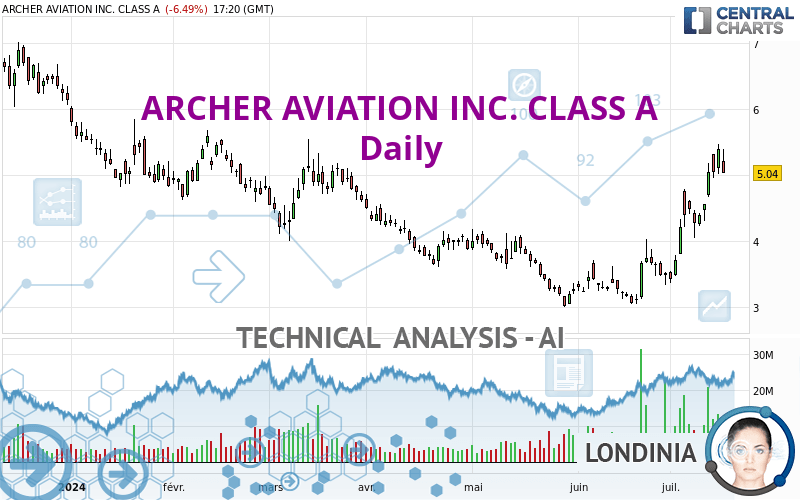
The ARCHER AVIATION INC. CLASS A price is 5.04 USD. The price registered a decrease of -6.49% on the session and was traded between 5.03 USD and 5.39 USD over the period. The price is currently at +0.20% from its lowest and -6.49% from its highest.A bearish opening was detected by the Central Gaps scanner. Sellers are trying to impose a bearish trend in the very short term.
Bearish opening
Type : Bearish
Timeframe : Openning
A study of price movements over other periods shows the following variations:
Near a new HIGH record (1 month)
Type : Bullish
Timeframe : Weekly
Technical
Technical analysis of ARCHER AVIATION INC. CLASS A in Daily shows a strongly overall bullish trend. The signals given by the moving averages are 85.71% bullish. This strong bullish trend is confirmed by the strong signals currently being given by short-term moving averages. An assessment of moving averages reveals a bullish signal that could impact this trend:
Bullish trend reversal : Moving Average 100
Type : Bullish
Timeframe : Daily
In fact, 15 technical indicators on 18 studied are currently positioned bullish. Caution: the Central Indicators scanner currently detects an excess:
CCI indicator is overbought : over 100
Type : Neutral
Timeframe : Daily
Williams %R indicator is overbought : over -20
Type : Neutral
Timeframe : Daily
Pivot points : price is under support 1
Type : Neutral
Timeframe : Daily
Central Patterns, the scanner specializing in chart patterns, did not identify any signals.
The Central Candlesticks scanner which studies Japanese candlesticks did not detect anything.
| S3 | S2 | S1 | Price | R1 | R2 | R3 | |
|---|---|---|---|---|---|---|---|
| ProTrendLines | 2.61 | 3.15 | 4.45 | 5.04 | 5.14 | 5.59 | 6.46 |
| Change (%) | -48.21% | -37.50% | -11.71% | - | +1.98% | +10.91% | +28.17% |
| Change | -2.43 | -1.89 | -0.59 | - | +0.10 | +0.55 | +1.42 |
| Level | Minor | Major | Major | - | Intermediate | Intermediate | Minor |
To determine price objectives, it is also possible to use the pivot points. Here is the price position in relation to pivot points:
| Pivot points | S3 | S2 | S1 | PP | R1 | R2 | R3 |
|---|---|---|---|---|---|---|---|
| Standard | 4.67 | 4.84 | 5.12 | 5.29 | 5.57 | 5.74 | 6.02 |
| Camarilla | 5.27 | 5.31 | 5.35 | 5.39 | 5.43 | 5.47 | 5.51 |
| Woodie | 4.72 | 4.87 | 5.17 | 5.32 | 5.62 | 5.77 | 6.07 |
| Fibonacci | 4.84 | 5.02 | 5.12 | 5.29 | 5.47 | 5.57 | 5.74 |
| Pivot points | S3 | S2 | S1 | PP | R1 | R2 | R3 |
|---|---|---|---|---|---|---|---|
| Standard | 3.21 | 3.63 | 4.34 | 4.76 | 5.47 | 5.89 | 6.60 |
| Camarilla | 4.74 | 4.84 | 4.95 | 5.05 | 5.15 | 5.26 | 5.36 |
| Woodie | 3.36 | 3.70 | 4.49 | 4.83 | 5.62 | 5.96 | 6.75 |
| Fibonacci | 3.63 | 4.06 | 4.33 | 4.76 | 5.19 | 5.46 | 5.89 |
| Pivot points | S3 | S2 | S1 | PP | R1 | R2 | R3 |
|---|---|---|---|---|---|---|---|
| Standard | 2.04 | 2.54 | 3.03 | 3.53 | 4.02 | 4.52 | 5.01 |
| Camarilla | 3.25 | 3.34 | 3.43 | 3.52 | 3.61 | 3.70 | 3.79 |
| Woodie | 2.04 | 2.54 | 3.03 | 3.53 | 4.02 | 4.52 | 5.01 |
| Fibonacci | 2.54 | 2.92 | 3.15 | 3.53 | 3.91 | 4.14 | 4.52 |
Numerical data
The following is the status of the technical indicators and moving averages at the time of publication of this technical analysis:
| RSI (14): | 69.60 | |
| MACD (12,26,9): | 0.4300 | |
| Directional Movement: | 30.84 | |
| AROON (14): | 78.57 | |
| DEMA (21): | 4.79 | |
| Parabolic SAR (0,02-0,02-0,2): | 4.32 | |
| Elder Ray (13): | 0.66 | |
| Super Trend (3,10): | 4.22 | |
| Zig ZAG (10): | 5.08 | |
| VORTEX (21): | 1.2400 | |
| Stochastique (14,3,5): | 88.05 | |
| TEMA (21): | 5.16 | |
| Williams %R (14): | -18.30 | |
| Chande Momentum Oscillator (20): | 1.55 | |
| Repulse (5,40,3): | 0.5100 | |
| ROCnROLL: | 1 | |
| TRIX (15,9): | 1.1300 | |
| Courbe Coppock: | 79.17 |
| MA7: | 4.83 | |
| MA20: | 4.10 | |
| MA50: | 3.73 | |
| MA100: | 4.07 | |
| MAexp7: | 4.87 | |
| MAexp20: | 4.31 | |
| MAexp50: | 4.00 | |
| MAexp100: | 4.17 | |
| Price / MA7: | +4.35% | |
| Price / MA20: | +22.93% | |
| Price / MA50: | +35.12% | |
| Price / MA100: | +23.83% | |
| Price / MAexp7: | +3.49% | |
| Price / MAexp20: | +16.94% | |
| Price / MAexp50: | +26.00% | |
| Price / MAexp100: | +20.86% |
News
The last news published on ARCHER AVIATION INC. CLASS A at the time of the generation of this analysis was as follows:
- SHAREHOLDER ACTION ALERT: The Schall Law Firm Encourages Investors in Archer Aviation Inc. with Losses of $100,000 to Contact the Firm
- SHAREHOLDER ACTION ALERT: The Schall Law Firm Encourages Investors in Archer Aviation Inc. with Losses of $100,000 to Contact the Firm
- SHAREHOLDER ACTION ALERT: The Schall Law Firm Encourages Investors in Archer Aviation Inc. with Losses of $100,000 to Contact the Firm
- SHAREHOLDER ACTION ALERT: The Schall Law Firm Encourages Investors in Archer Aviation Inc. with Losses of $100,000 to Contact the Firm
- INVESTOR ACTION NOTICE: The Schall Law Firm Encourages Investors in Archer Aviation Inc. with Losses of $100,000 to Contact the Firm
About author

Online


Add a comment
Comments
0 comments on the analysis ARCHER AVIATION INC. CLASS A - Daily