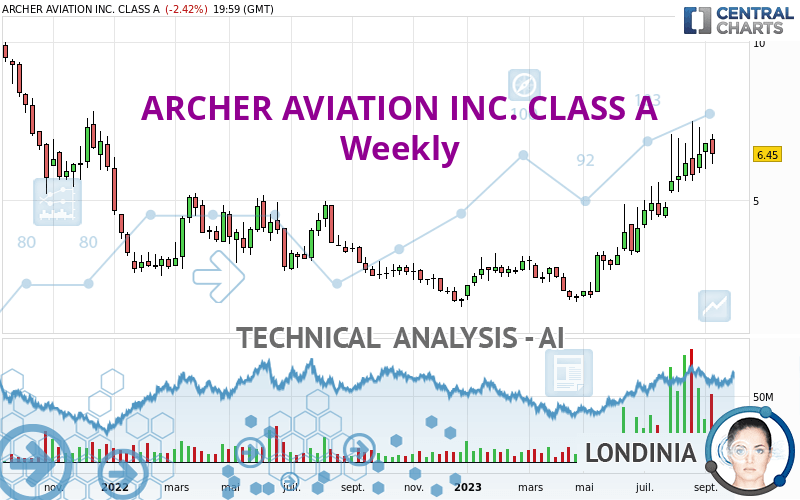
ARCHER AVIATION INC. CLASS A - Weekly - Technical analysis published on 09/18/2023 (GMT)
- 87
- 0
Click here for a new analysis!
- Timeframe : Weekly
- - Analysis generated on
- Status : INVALID

Summary of the analysis

Additional analysis
Quotes
The ARCHER AVIATION INC. CLASS A price is 6.45 USD. The price is lower by -7.46% over the 5 days with the lowest point at 6.13 USD and the highest point at 6.79 USD. The deviation from the price is +5.22% for the low point and -5.01% for the high point.The Central Gaps scanner detects a bullish opening. A small advantage for buyers in the very short term.
Bullish opening
Type : Bullish
Timeframe : Openning
A study of price movements over other periods shows the following variations:
Abnormal volumes
Timeframe : 5 days
Abnormal volumes
Timeframe : 20 days
Abnormal volumes
Timeframe : 50 days
Technical
A technical analysis in Weekly of this ARCHER AVIATION INC. CLASS A chart shows a bullish trend. 75.00% of the signals given by moving averages are bullish. This bullish trend is supported by the strong bullish signals given by short-term moving averages. There is no crossing of moving average by the price or crossing of moving averages between themselves.
The probability of a further increase is high given the direction of the technical indicators.
Caution: the Central Indicators scanner currently detects an excess:
CCI indicator is overbought : over 100
Type : Neutral
Timeframe : Weekly
RSI indicator: bearish divergence
Type : Bearish
Timeframe : Weekly
Price is back under the pivot point
Type : Bearish
Timeframe : Weekly
The analysis of the price chart with Central Patterns scanners does not return any result.
The presence of a bearish pattern in Japanese candlesticks detected by Central Candlesticks that could cause a correction in the very short term was also detected:
Bearish engulfing lines
Type : Bearish
Timeframe : Weekly
| S3 | S2 | S1 | Price | R1 | |
|---|---|---|---|---|---|
| ProTrendLines | 2.61 | 3.15 | 4.84 | 6.45 | 7.31 |
| Change (%) | -59.53% | -51.16% | -24.96% | - | +13.33% |
| Change | -3.84 | -3.30 | -1.61 | - | +0.86 |
| Level | Minor | Major | Major | - | Major |
Pivot points can also be used to set your price objectives. Here is the price situation in relation to pivot points:
| Pivot points | S3 | S2 | S1 | PP | R1 | R2 | R3 |
|---|---|---|---|---|---|---|---|
| Standard | 5.60 | 5.86 | 6.16 | 6.42 | 6.72 | 6.98 | 7.28 |
| Camarilla | 6.30 | 6.35 | 6.40 | 6.45 | 6.50 | 6.55 | 6.60 |
| Woodie | 5.61 | 5.87 | 6.17 | 6.43 | 6.73 | 6.99 | 7.29 |
| Fibonacci | 5.86 | 6.08 | 6.21 | 6.42 | 6.64 | 6.77 | 6.98 |
| Pivot points | S3 | S2 | S1 | PP | R1 | R2 | R3 |
|---|---|---|---|---|---|---|---|
| Standard | 5.41 | 5.70 | 6.25 | 6.54 | 7.09 | 7.38 | 7.93 |
| Camarilla | 6.58 | 6.66 | 6.73 | 6.81 | 6.89 | 6.96 | 7.04 |
| Woodie | 5.55 | 5.77 | 6.39 | 6.61 | 7.23 | 7.45 | 8.07 |
| Fibonacci | 5.70 | 6.02 | 6.22 | 6.54 | 6.86 | 7.06 | 7.38 |
| Pivot points | S3 | S2 | S1 | PP | R1 | R2 | R3 |
|---|---|---|---|---|---|---|---|
| Standard | 3.41 | 4.33 | 5.65 | 6.57 | 7.89 | 8.81 | 10.13 |
| Camarilla | 6.35 | 6.56 | 6.77 | 6.97 | 7.18 | 7.38 | 7.59 |
| Woodie | 3.61 | 4.43 | 5.85 | 6.67 | 8.09 | 8.91 | 10.33 |
| Fibonacci | 4.33 | 5.19 | 5.71 | 6.57 | 7.43 | 7.95 | 8.81 |
Numerical data
The following are the details of the technical indicators and moving averages that were collected to generate this technical analysis:
| RSI (14): | 71.04 | |
| MACD (12,26,9): | 0.9700 | |
| Directional Movement: | 27.00 | |
| AROON (14): | 78.57 | |
| DEMA (21): | 6.06 | |
| Parabolic SAR (0,02-0,02-0,2): | 5.86 | |
| Elder Ray (13): | 1.31 | |
| Super Trend (3,10): | 3.52 | |
| Zig ZAG (10): | 6.61 | |
| VORTEX (21): | 1.1800 | |
| Stochastique (14,3,5): | 80.76 | |
| TEMA (21): | 6.77 | |
| Williams %R (14): | -20.80 | |
| Chande Momentum Oscillator (20): | 3.23 | |
| Repulse (5,40,3): | -6.8200 | |
| ROCnROLL: | 1 | |
| TRIX (15,9): | 3.3200 | |
| Courbe Coppock: | 217.46 |
| MA7: | 6.60 | |
| MA20: | 6.61 | |
| MA50: | 5.88 | |
| MA100: | 4.48 | |
| MAexp7: | 6.10 | |
| MAexp20: | 4.91 | |
| MAexp50: | 4.06 | |
| MAexp100: | 4.14 | |
| Price / MA7: | -2.27% | |
| Price / MA20: | -2.42% | |
| Price / MA50: | +9.69% | |
| Price / MA100: | +43.97% | |
| Price / MAexp7: | +5.74% | |
| Price / MAexp20: | +31.36% | |
| Price / MAexp50: | +58.87% | |
| Price / MAexp100: | +55.80% |
News
The latest news and videos published on ARCHER AVIATION INC. CLASS A at the time of the analysis were as follows:
About author

Online


Add a comment
Comments
0 comments on the analysis ARCHER AVIATION INC. CLASS A - Weekly