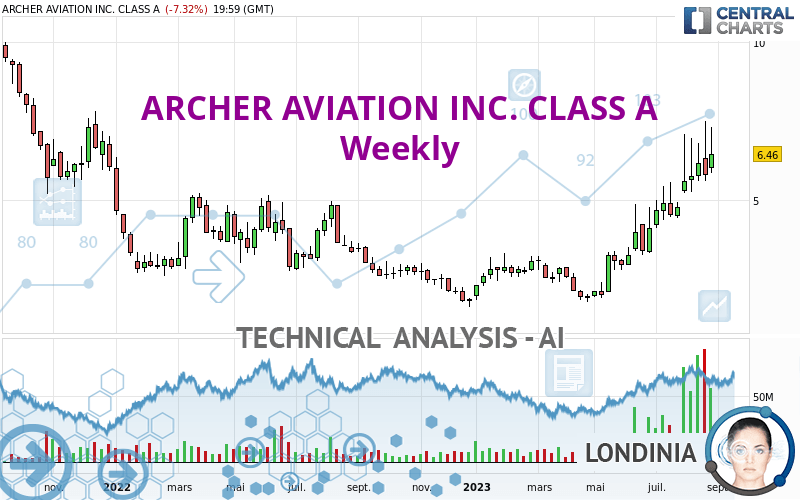
ARCHER AVIATION INC. CLASS A - Weekly - Technical analysis published on 09/03/2023 (GMT)
- 103
- 0
Click here for a new analysis!
- Timeframe : Weekly
- - Analysis generated on
- Status : INVALID

Summary of the analysis

Additional analysis
Quotes
The ARCHER AVIATION INC. CLASS A price is 6.46 USD. The price registered an increase of +11.77% over 5 days and was traded between 6.42 USD and 7.32 USD over the period. The price is currently at +0.62% from its lowest point and -11.75% from its highest point.The Central Gaps scanner detects a bullish opening marking the presence of buyers ahead of sellers at the opening but not sufficiently marked to allow the price to register a quotation gap.
Bullish opening
Type : Bullish
Timeframe : Openning
A study of price movements over other periods shows the following variations:
Abnormal volumes
Timeframe : 5 days
Abnormal volumes
Timeframe : 20 days
Abnormal volumes
Timeframe : 50 days
Technical
Technical analysis of ARCHER AVIATION INC. CLASS A in Weekly shows an overall bullish trend. The signals returned by the moving averages are 75.00% bullish. This bullish trend is reinforced by the strong signals currently being given by short-term moving averages. The Central Indicators market scanner is currently detecting a bullish signal that could impact this trend:
Bullish price crossover with adaptative moving average 100
Type : Bullish
Timeframe : Weekly
The probability of a further increase is high given the direction of the technical indicators.
Caution: the Central Indicators scanner currently detects an excess:
RSI indicator is overbought : over 70
Type : Neutral
Timeframe : Weekly
CCI indicator is overbought : over 100
Type : Neutral
Timeframe : Weekly
Price is back over the pivot point
Type : Bullish
Timeframe : Weekly
The analysis of the price chart with Central Patterns scanners does not return any result.
No result was found by the Central Candlesticks scanner on Japanese candlesticks.
| S3 | S2 | S1 | Price | R1 | |
|---|---|---|---|---|---|
| ProTrendLines | 2.61 | 3.15 | 4.84 | 6.46 | 7.31 |
| Change (%) | -59.60% | -51.24% | -25.08% | - | +13.16% |
| Change | -3.85 | -3.31 | -1.62 | - | +0.85 |
| Level | Minor | Major | Major | - | Major |
Attention could also be paid to pivot points to set price objectives:
| Pivot points | S3 | S2 | S1 | PP | R1 | R2 | R3 |
|---|---|---|---|---|---|---|---|
| Standard | 5.51 | 5.97 | 6.21 | 6.67 | 6.91 | 7.37 | 7.61 |
| Camarilla | 6.27 | 6.33 | 6.40 | 6.46 | 6.52 | 6.59 | 6.65 |
| Woodie | 5.41 | 5.92 | 6.11 | 6.62 | 6.81 | 7.32 | 7.51 |
| Fibonacci | 5.97 | 6.23 | 6.40 | 6.67 | 6.93 | 7.10 | 7.37 |
| Pivot points | S3 | S2 | S1 | PP | R1 | R2 | R3 |
|---|---|---|---|---|---|---|---|
| Standard | 3.23 | 4.43 | 5.10 | 6.30 | 6.97 | 8.17 | 8.84 |
| Camarilla | 5.27 | 5.44 | 5.61 | 5.78 | 5.95 | 6.12 | 6.29 |
| Woodie | 2.98 | 4.30 | 4.85 | 6.17 | 6.72 | 8.04 | 8.59 |
| Fibonacci | 4.43 | 5.14 | 5.58 | 6.30 | 7.01 | 7.45 | 8.17 |
| Pivot points | S3 | S2 | S1 | PP | R1 | R2 | R3 |
|---|---|---|---|---|---|---|---|
| Standard | 3.41 | 4.33 | 5.65 | 6.57 | 7.89 | 8.81 | 10.13 |
| Camarilla | 6.35 | 6.56 | 6.77 | 6.97 | 7.18 | 7.38 | 7.59 |
| Woodie | 3.61 | 4.43 | 5.85 | 6.67 | 8.09 | 8.91 | 10.33 |
| Fibonacci | 4.33 | 5.19 | 5.71 | 6.57 | 7.43 | 7.95 | 8.81 |
Numerical data
The following are the details of the technical indicators and moving averages that were collected to generate this technical analysis:
| RSI (14): | 72.04 | |
| MACD (12,26,9): | 0.8700 | |
| Directional Movement: | 27.89 | |
| AROON (14): | 85.72 | |
| DEMA (21): | 5.52 | |
| Parabolic SAR (0,02-0,02-0,2): | 5.57 | |
| Elder Ray (13): | 1.58 | |
| Super Trend (3,10): | 3.36 | |
| Zig ZAG (10): | 6.46 | |
| VORTEX (21): | 1.1200 | |
| Stochastique (14,3,5): | 74.30 | |
| TEMA (21): | 6.22 | |
| Williams %R (14): | -21.91 | |
| Chande Momentum Oscillator (20): | 3.21 | |
| Repulse (5,40,3): | -16.9600 | |
| ROCnROLL: | 1 | |
| TRIX (15,9): | 2.9000 | |
| Courbe Coppock: | 229.47 |
| MA7: | 6.57 | |
| MA20: | 6.35 | |
| MA50: | 5.41 | |
| MA100: | 4.08 | |
| MAexp7: | 5.64 | |
| MAexp20: | 4.51 | |
| MAexp50: | 3.84 | |
| MAexp100: | 4.04 | |
| Price / MA7: | -1.67% | |
| Price / MA20: | +1.73% | |
| Price / MA50: | +19.41% | |
| Price / MA100: | +58.33% | |
| Price / MAexp7: | +14.54% | |
| Price / MAexp20: | +43.24% | |
| Price / MAexp50: | +68.23% | |
| Price / MAexp100: | +59.90% |
News
The latest news and videos published on ARCHER AVIATION INC. CLASS A at the time of the analysis were as follows:
About author

Online


Add a comment
Comments
0 comments on the analysis ARCHER AVIATION INC. CLASS A - Weekly