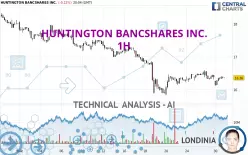
HUNTINGTON BANCSHARES INC. - 1H - Technical analysis published on 12/30/2024 (GMT)
- 130
- 0
Click here for a new analysis!
- Timeframe : 1H
- - Analysis generated on
- Status : TARGET REACHED

Summary of the analysis

Additional analysis
Quotes
The HUNTINGTON BANCSHARES INC. price is 16.36 USD. On the day, this instrument lost -0.12% with the lowest point at 16.11 USD and the highest point at 16.41 USD. The deviation from the price is +1.55% for the low point and -0.30% for the high point.The Central Gaps scanner detects the formation of a bearish gap marking the strong presence of sellers ahead of buyers at the opening. This formed a quotation gap.
Opening Gap DOWN
Type : Bearish
Timeframe : Openning
Here is a more detailed summary of the historical variations registered by HUNTINGTON BANCSHARES INC.:
Near a new LOW record (1 month)
Type : Bearish
Timeframe : Weekly
Technical
A technical analysis in 1H of this HUNTINGTON BANCSHARES INC. chart shows a sharp bearish trend. 82.14% of the signals given by moving averages are bearish. This strongly bearish trend is showing signs of slowing down given the slightly bearish signals given by short-term moving averages. The Central Indicators market scanner is currently detecting several bearish and bullish signals that could impact this trend:
Bearish trend reversal : Moving Average 20
Type : Bearish
Timeframe : 1 hour
Bullish trend reversal : adaptative moving average 20
Type : Bullish
Timeframe : 1 hour
The probability of a further increase is slight given the direction of the technical indicators.
Central Indicators, the detector scanner for these technical indicators recently detected a signal:
RSI indicator is back under 50
Type : Bearish
Timeframe : 1 hour
An analysis of the price chart with the Central Patterns scanner (detector of chart patterns and resistances and supports) shows a result that can have an impact on the price change:
Near resistance of channel
Type : Bearish
Timeframe : 1 hour
Central Candlesticks, the scanner specialised in Japanese candlesticks, detects a bearish signal that could support the hypothesis of a small drop in the very short term:
Bearish harami
Type : Bearish
Timeframe : 1 hour
| S3 | S2 | S1 | Price | R1 | R2 | R3 | |
|---|---|---|---|---|---|---|---|
| ProTrendLines | 15.20 | 15.91 | 16.27 | 16.36 | 16.46 | 17.34 | 17.69 |
| Change (%) | -7.09% | -2.75% | -0.55% | - | +0.61% | +5.99% | +8.13% |
| Change | -1.16 | -0.45 | -0.09 | - | +0.10 | +0.98 | +1.33 |
| Level | Major | Intermediate | Minor | - | Intermediate | Intermediate | Minor |
Attention could also be paid to pivot points to set price objectives:
| Pivot points | S3 | S2 | S1 | PP | R1 | R2 | R3 |
|---|---|---|---|---|---|---|---|
| Standard | 15.97 | 16.13 | 16.26 | 16.42 | 16.55 | 16.71 | 16.84 |
| Camarilla | 16.30 | 16.33 | 16.35 | 16.38 | 16.41 | 16.43 | 16.46 |
| Woodie | 15.95 | 16.12 | 16.24 | 16.41 | 16.53 | 16.70 | 16.82 |
| Fibonacci | 16.13 | 16.24 | 16.31 | 16.42 | 16.53 | 16.60 | 16.71 |
| Pivot points | S3 | S2 | S1 | PP | R1 | R2 | R3 |
|---|---|---|---|---|---|---|---|
| Standard | 15.70 | 15.92 | 16.15 | 16.37 | 16.60 | 16.82 | 17.05 |
| Camarilla | 16.26 | 16.30 | 16.34 | 16.38 | 16.42 | 16.46 | 16.50 |
| Woodie | 15.71 | 15.92 | 16.16 | 16.37 | 16.61 | 16.82 | 17.06 |
| Fibonacci | 15.92 | 16.09 | 16.20 | 16.37 | 16.54 | 16.65 | 16.82 |
| Pivot points | S3 | S2 | S1 | PP | R1 | R2 | R3 |
|---|---|---|---|---|---|---|---|
| Standard | 12.72 | 13.91 | 15.88 | 17.07 | 19.04 | 20.23 | 22.20 |
| Camarilla | 16.97 | 17.26 | 17.55 | 17.84 | 18.13 | 18.42 | 18.71 |
| Woodie | 13.10 | 14.11 | 16.26 | 17.27 | 19.42 | 20.43 | 22.58 |
| Fibonacci | 13.91 | 15.12 | 15.87 | 17.07 | 18.28 | 19.03 | 20.23 |
Numerical data
The following are the details of the technical indicators and moving averages that were collected to generate this technical analysis:
| RSI (14): | 49.38 | |
| MACD (12,26,9): | -0.0200 | |
| Directional Movement: | -3.42 | |
| AROON (14): | -50.00 | |
| DEMA (21): | 16.35 | |
| Parabolic SAR (0,02-0,02-0,2): | 16.43 | |
| Elder Ray (13): | 0.01 | |
| Super Trend (3,10): | 16.56 | |
| Zig ZAG (10): | 16.37 | |
| VORTEX (21): | 1.0200 | |
| Stochastique (14,3,5): | 53.76 | |
| TEMA (21): | 16.36 | |
| Williams %R (14): | -44.79 | |
| Chande Momentum Oscillator (20): | -0.18 | |
| Repulse (5,40,3): | 0.5900 | |
| ROCnROLL: | -1 | |
| TRIX (15,9): | 0.0000 | |
| Courbe Coppock: | 1.46 |
| MA7: | 16.32 | |
| MA20: | 16.85 | |
| MA50: | 16.70 | |
| MA100: | 15.49 | |
| MAexp7: | 16.35 | |
| MAexp20: | 16.37 | |
| MAexp50: | 16.45 | |
| MAexp100: | 16.66 | |
| Price / MA7: | +0.25% | |
| Price / MA20: | -2.91% | |
| Price / MA50: | -2.04% | |
| Price / MA100: | +5.62% | |
| Price / MAexp7: | +0.06% | |
| Price / MAexp20: | -0.06% | |
| Price / MAexp50: | -0.55% | |
| Price / MAexp100: | -1.80% |
News
Don't forget to follow the news on HUNTINGTON BANCSHARES INC.. At the time of publication of this analysis, the latest news was as follows:
- Investor Network: Huntington Bancshares Incorporated to Host Earnings Call
-
 Huntington's Disease Linked To Dysfunctional Brain Structure
-
Huntington Bancshares
- Growblox Sciences Announces Patent Application for Treatments of Parkinson's Disease, Alzheimer's Disease, Huntington's Disease and Dementia
- InvestorsObserver releases covered-call reports for Alibaba, ConocoPhillips, Facebook, Huntington Ingalls Industries and Suncor Energy
About author
Online


Add a comment
Comments
0 comments on the analysis HUNTINGTON BANCSHARES INC. - 1H