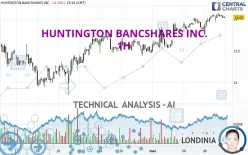
HUNTINGTON BANCSHARES INC. - 1H - Technical analysis published on 05/09/2024 (GMT)
- 153
- 0
Click here for a new analysis!
- Timeframe : 1H
- - Analysis generated on
- Status : LEVEL MAINTAINED

Summary of the analysis

Additional analysis
Quotes
The HUNTINGTON BANCSHARES INC. rating is 14.03 USD. The price is lower by -0.14% since the last closing with the lowest point at 13.97 USD and the highest point at 14.10 USD. The deviation from the price is +0.43% for the low point and -0.50% for the high point.So that you have an overall view of the price change, here is a table showing the variations over several periods:
New HIGH record (1 year)
Type : Bullish
Timeframe : Weekly
New HIGH record (1st january)
Type : Bullish
Timeframe : Weekly
New HIGH record (1 month)
Type : Bullish
Timeframe : Weekly
Technical
Technical analysis of this 1H chart of HUNTINGTON BANCSHARES INC. indicates that the overall trend is strongly bullish. 92.86% of the signals given by moving averages are bullish. This strongly bullish trend is supported by the strong bullish signals given by short-term moving averages. The Central Indicators market scanner currently does not detect any result that concerns moving averages.
The technical indicators are bullish. There is still some doubt about the price increase.
Caution: the Central Indicators scanner currently detects an excess:
Williams %R indicator is overbought : over -20
Type : Neutral
Timeframe : 1 hour
Pivot points : price is over resistance 1
Type : Neutral
Timeframe : Weekly
The Central Patterns scanner, which studies chart patterns, resistances and supports, has identified this signal:
Near resistance of channel
Type : Bearish
Timeframe : 1 hour
No result was found by the Central Candlesticks scanner on Japanese candlesticks.
| S3 | S2 | S1 | Price | R1 | R2 | |
|---|---|---|---|---|---|---|
| ProTrendLines | 13.42 | 13.76 | 14.03 | 14.03 | 14.54 | 15.71 |
| Change (%) | -4.35% | -1.92% | 0% | - | +3.64% | +11.97% |
| Change | -0.61 | -0.27 | 0 | - | +0.51 | +1.68 |
| Level | Minor | Major | Intermediate | - | Intermediate | Major |
Attention could also be paid to pivot points to set price objectives:
| Pivot points | S3 | S2 | S1 | PP | R1 | R2 | R3 |
|---|---|---|---|---|---|---|---|
| Standard | 13.51 | 13.63 | 13.84 | 13.96 | 14.17 | 14.29 | 14.50 |
| Camarilla | 13.96 | 13.99 | 14.02 | 14.05 | 14.08 | 14.11 | 14.14 |
| Woodie | 13.56 | 13.65 | 13.89 | 13.98 | 14.22 | 14.31 | 14.55 |
| Fibonacci | 13.63 | 13.76 | 13.83 | 13.96 | 14.09 | 14.16 | 14.29 |
| Pivot points | S3 | S2 | S1 | PP | R1 | R2 | R3 |
|---|---|---|---|---|---|---|---|
| Standard | 12.95 | 13.19 | 13.49 | 13.73 | 14.03 | 14.27 | 14.57 |
| Camarilla | 13.65 | 13.70 | 13.75 | 13.80 | 13.85 | 13.90 | 13.95 |
| Woodie | 12.99 | 13.21 | 13.53 | 13.75 | 14.07 | 14.29 | 14.61 |
| Fibonacci | 13.19 | 13.39 | 13.52 | 13.73 | 13.93 | 14.06 | 14.27 |
| Pivot points | S3 | S2 | S1 | PP | R1 | R2 | R3 |
|---|---|---|---|---|---|---|---|
| Standard | 11.55 | 12.18 | 12.82 | 13.45 | 14.09 | 14.72 | 15.36 |
| Camarilla | 13.12 | 13.24 | 13.35 | 13.47 | 13.59 | 13.70 | 13.82 |
| Woodie | 11.57 | 12.18 | 12.84 | 13.45 | 14.11 | 14.72 | 15.38 |
| Fibonacci | 12.18 | 12.66 | 12.96 | 13.45 | 13.93 | 14.23 | 14.72 |
Numerical data
The following is the status of technical indicators and moving averages registered at the time this technical analysis was created:
| RSI (14): | 60.54 | |
| MACD (12,26,9): | 0.0600 | |
| Directional Movement: | 2.86 | |
| AROON (14): | 64.29 | |
| DEMA (21): | 14.08 | |
| Parabolic SAR (0,02-0,02-0,2): | 13.91 | |
| Elder Ray (13): | 0.02 | |
| Super Trend (3,10): | 13.88 | |
| Zig ZAG (10): | 14.04 | |
| VORTEX (21): | 1.0500 | |
| Stochastique (14,3,5): | 82.86 | |
| TEMA (21): | 14.07 | |
| Williams %R (14): | -15.71 | |
| Chande Momentum Oscillator (20): | 0.05 | |
| Repulse (5,40,3): | -0.0500 | |
| ROCnROLL: | 1 | |
| TRIX (15,9): | 0.0700 | |
| Courbe Coppock: | 1.84 |
| MA7: | 13.86 | |
| MA20: | 13.56 | |
| MA50: | 13.47 | |
| MA100: | 13.02 | |
| MAexp7: | 14.04 | |
| MAexp20: | 13.99 | |
| MAexp50: | 13.88 | |
| MAexp100: | 13.75 | |
| Price / MA7: | +1.23% | |
| Price / MA20: | +3.47% | |
| Price / MA50: | +4.16% | |
| Price / MA100: | +7.76% | |
| Price / MAexp7: | -0.07% | |
| Price / MAexp20: | +0.29% | |
| Price / MAexp50: | +1.08% | |
| Price / MAexp100: | +2.04% |
News
The last news published on HUNTINGTON BANCSHARES INC. at the time of the generation of this analysis was as follows:
- Investor Network: Huntington Bancshares Incorporated to Host Earnings Call
-
 Huntington's Disease Linked To Dysfunctional Brain Structure
-
Huntington Bancshares
- Growblox Sciences Announces Patent Application for Treatments of Parkinson's Disease, Alzheimer's Disease, Huntington's Disease and Dementia
- InvestorsObserver releases covered-call reports for Alibaba, ConocoPhillips, Facebook, Huntington Ingalls Industries and Suncor Energy
About author
Online


Add a comment
Comments
0 comments on the analysis HUNTINGTON BANCSHARES INC. - 1H