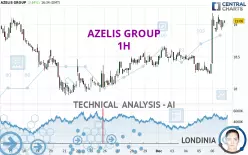
AZELIS GROUP - 1H - Technical analysis published on 12/09/2024 (GMT)
- 146
- 0
Click here for a new analysis!
- Timeframe : 1H
- - Analysis generated on
- Status : TARGET REACHED

Summary of the analysis

Additional analysis
Quotes
The AZELIS GROUP price is 19.06 EUR. On the day, this instrument gained +3.64% and was traded between 18.39 EUR and 19.18 EUR over the period. The price is currently at +3.64% from its lowest and -0.63% from its highest.A bullish opening was detected by the Central Gaps scanner. Buyers are trying to impose a bullish momentum in the very short term.
Bullish opening
Type : Bullish
Timeframe : Openning
So that you have an overall view of the price change, here is a table showing the variations over several periods:
Near a new HIGH record (1 month)
Type : Bullish
Timeframe : Weekly
Abnormal volumes on AZELIS GROUP were detected by the Central Volumes scanner:
Abnormal volumes
Timeframe : 20 days
Technical
Technical analysis of this 1H chart of AZELIS GROUP indicates that the overall trend is strongly bullish. The signals given by the moving averages are 92.86% bullish. This strong bullish trend is confirmed by the strong signals currently being given by short-term moving averages. There is no crossing of moving average by the price or crossing of moving averages between themselves.
An assessment of technical indicators shows a strong bullish signal.
Caution: the Central Indicators scanner currently detects an excess:
Williams %R indicator is overbought : over -20
Type : Neutral
Timeframe : 1 hour
Pivot points : price is over resistance 2
Type : Neutral
Timeframe : Weekly
Pivot points : price is over resistance 3
Type : Neutral
Timeframe : 1 hour
The Central Patterns scanner, which studies chart patterns, resistances and supports, has identified this signal:
Near resistance of channel
Type : Bearish
Timeframe : 1 hour
The Central Candlesticks scanner which studies Japanese candlesticks did not detect anything.
| S3 | S2 | S1 | Price | R1 | R2 | R3 | |
|---|---|---|---|---|---|---|---|
| ProTrendLines | 18.24 | 18.56 | 19.01 | 19.06 | 19.16 | 19.46 | 19.71 |
| Change (%) | -4.30% | -2.62% | -0.26% | - | +0.52% | +2.10% | +3.41% |
| Change | -0.82 | -0.50 | -0.05 | - | +0.10 | +0.40 | +0.65 |
| Level | Intermediate | Major | Minor | - | Intermediate | Minor | Major |
To determine price objectives, it is also possible to use the pivot points. Here is the price position in relation to pivot points:
| Pivot points | S3 | S2 | S1 | PP | R1 | R2 | R3 |
|---|---|---|---|---|---|---|---|
| Standard | 17.78 | 18.09 | 18.57 | 18.88 | 19.36 | 19.67 | 20.15 |
| Camarilla | 18.84 | 18.92 | 18.99 | 19.06 | 19.13 | 19.21 | 19.28 |
| Woodie | 17.88 | 18.13 | 18.67 | 18.92 | 19.46 | 19.71 | 20.25 |
| Fibonacci | 18.09 | 18.39 | 18.58 | 18.88 | 19.18 | 19.37 | 19.67 |
| Pivot points | S3 | S2 | S1 | PP | R1 | R2 | R3 |
|---|---|---|---|---|---|---|---|
| Standard | 17.42 | 17.69 | 18.05 | 18.32 | 18.68 | 18.95 | 19.31 |
| Camarilla | 18.25 | 18.31 | 18.36 | 18.42 | 18.48 | 18.54 | 18.59 |
| Woodie | 17.48 | 17.71 | 18.11 | 18.34 | 18.74 | 18.97 | 19.37 |
| Fibonacci | 17.69 | 17.93 | 18.08 | 18.32 | 18.56 | 18.71 | 18.95 |
| Pivot points | S3 | S2 | S1 | PP | R1 | R2 | R3 |
|---|---|---|---|---|---|---|---|
| Standard | 15.62 | 16.76 | 17.59 | 18.73 | 19.56 | 20.70 | 21.53 |
| Camarilla | 17.88 | 18.06 | 18.24 | 18.42 | 18.60 | 18.78 | 18.96 |
| Woodie | 15.47 | 16.68 | 17.44 | 18.65 | 19.41 | 20.62 | 21.38 |
| Fibonacci | 16.76 | 17.51 | 17.98 | 18.73 | 19.48 | 19.95 | 20.70 |
Numerical data
The following is the status of the technical indicators and moving averages at the time of publication of this technical analysis:
| RSI (14): | 66.28 | |
| MACD (12,26,9): | 0.1700 | |
| Directional Movement: | 27.49 | |
| AROON (14): | 21.43 | |
| DEMA (21): | 18.95 | |
| Parabolic SAR (0,02-0,02-0,2): | 18.36 | |
| Elder Ray (13): | 0.19 | |
| Super Trend (3,10): | 18.65 | |
| Zig ZAG (10): | 19.06 | |
| VORTEX (21): | 1.1900 | |
| Stochastique (14,3,5): | 82.62 | |
| TEMA (21): | 19.08 | |
| Williams %R (14): | -12.77 | |
| Chande Momentum Oscillator (20): | 0.77 | |
| Repulse (5,40,3): | 0.5000 | |
| ROCnROLL: | 1 | |
| TRIX (15,9): | 0.0900 | |
| Courbe Coppock: | 7.64 |
| MA7: | 18.54 | |
| MA20: | 18.53 | |
| MA50: | 18.74 | |
| MA100: | 18.53 | |
| MAexp7: | 18.98 | |
| MAexp20: | 18.76 | |
| MAexp50: | 18.58 | |
| MAexp100: | 18.51 | |
| Price / MA7: | +2.80% | |
| Price / MA20: | +2.86% | |
| Price / MA50: | +1.71% | |
| Price / MA100: | +2.86% | |
| Price / MAexp7: | +0.42% | |
| Price / MAexp20: | +1.60% | |
| Price / MAexp50: | +2.58% | |
| Price / MAexp100: | +2.97% |
News
The last news published on AZELIS GROUP at the time of the generation of this analysis was as follows:
- Azelis Group NV: Transparency notification
- Azelis Reinforces Its Presence in the Nordics Through the Acquisition of Haarla Oy
- Azelis Group NV: Transparency Notification
- Azelis Appoints Todd Cottrell to Succeed Frank Bergonzi as CEO of Azelis Americas
- Azelis Appoints Anna Bertona as New Chief Executive Officer
About author
Online


Add a comment
Comments
0 comments on the analysis AZELIS GROUP - 1H