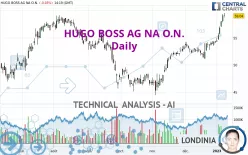
HUGO BOSS AG NA O.N. - Daily - Technical analysis published on 01/09/2023 (GMT)
- 214
- 0
Click here for a new analysis!
- Timeframe : Daily
- - Analysis generated on
- Status : TARGET REACHED
Summary of the analysis

Additional analysis
Quotes
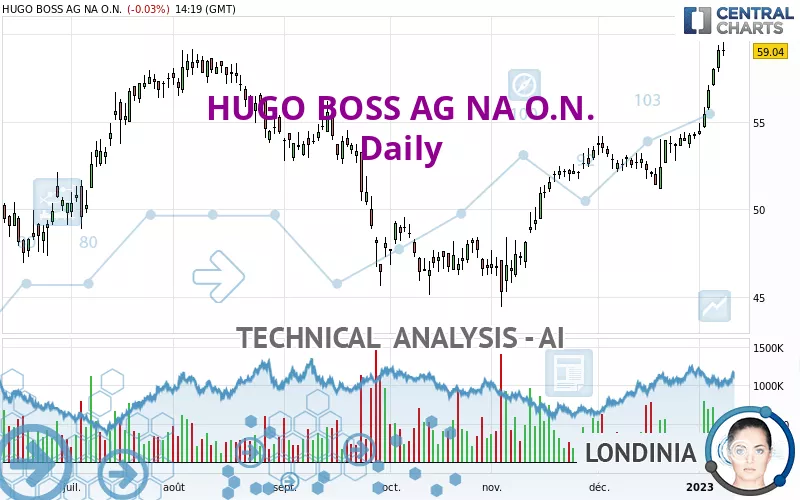
HUGO BOSS AG NA O.N. rating 59.04 EUR. On the day, this instrument lost -0.03% with the lowest point at 58.74 EUR and the highest point at 59.54 EUR. The deviation from the price is +0.51% for the low point and -0.84% for the high point.The Central Gaps scanner detects a bullish opening. A small advantage for buyers in the very short term.
Bullish opening
Type : Bullish
Timeframe : Openning
So that you have an overall view of the price change, here is a table showing the variations over several periods:
New HIGH record (1 year)
Type : Bullish
Timeframe : Weekly
New HIGH record (1st january)
Type : Bullish
Timeframe : Weekly
New HIGH record (1 month)
Type : Bullish
Timeframe : Weekly
Technical
Technical analysis of HUGO BOSS AG NA O.N. in Daily shows a strongly overall bullish trend. 92.86% of the signals given by moving averages are bullish. This strongly bullish trend is supported by the strong bullish signals given by short-term moving averages. The Central Indicators market scanner currently does not detect any result that concerns moving averages.
The probability of a further increase is high given the direction of the technical indicators.
But beware of excesses. The Central Indicators scanner currently detects this:
RSI indicator is overbought : over 80
Type : Neutral
Timeframe : Daily
CCI indicator is overbought : over 100
Type : Neutral
Timeframe : Daily
Previous candle closed over Bollinger bands
Type : Neutral
Timeframe : Daily
Williams %R indicator is overbought : over -20
Type : Neutral
Timeframe : Daily
The Central Patterns scanner, which studies chart patterns, resistances and supports, has identified this signal:
Near horizontal support
Type : Bullish
Timeframe : Daily
Central Candlesticks, the scanner specialised in Japanese candlesticks, detects this inversion signal that could impact the current short-term trend:
Doji
Type : Neutral
Timeframe : Daily
| S3 | S2 | S1 | Price | R1 | R2 | R3 | |
|---|---|---|---|---|---|---|---|
| ProTrendLines | 51.41 | 53.62 | 58.47 | 59.04 | 62.90 | 66.95 | 78.82 |
| Change (%) | -12.92% | -9.18% | -0.97% | - | +6.54% | +13.40% | +33.50% |
| Change | -7.63 | -5.42 | -0.57 | - | +3.86 | +7.91 | +19.78 |
| Level | Major | Intermediate | Major | - | Minor | Minor | Intermediate |
Pivot points can also be used to set your price objectives. Here is the price situation in relation to pivot points:
| Pivot points | S3 | S2 | S1 | PP | R1 | R2 | R3 |
|---|---|---|---|---|---|---|---|
| Standard | 56.56 | 57.18 | 58.12 | 58.74 | 59.68 | 60.30 | 61.24 |
| Camarilla | 58.63 | 58.77 | 58.92 | 59.06 | 59.20 | 59.35 | 59.49 |
| Woodie | 56.72 | 57.26 | 58.28 | 58.82 | 59.84 | 60.38 | 61.40 |
| Fibonacci | 57.18 | 57.78 | 58.14 | 58.74 | 59.34 | 59.70 | 60.30 |
| Pivot points | S3 | S2 | S1 | PP | R1 | R2 | R3 |
|---|---|---|---|---|---|---|---|
| Standard | 50.63 | 52.43 | 55.75 | 57.55 | 60.87 | 62.67 | 65.99 |
| Camarilla | 57.65 | 58.12 | 58.59 | 59.06 | 59.53 | 60.00 | 60.47 |
| Woodie | 51.38 | 52.81 | 56.50 | 57.93 | 61.62 | 63.05 | 66.74 |
| Fibonacci | 52.43 | 54.39 | 55.60 | 57.55 | 59.51 | 60.72 | 62.67 |
| Pivot points | S3 | S2 | S1 | PP | R1 | R2 | R3 |
|---|---|---|---|---|---|---|---|
| Standard | 48.75 | 49.93 | 52.05 | 53.23 | 55.35 | 56.53 | 58.65 |
| Camarilla | 53.25 | 53.56 | 53.86 | 54.16 | 54.46 | 54.77 | 55.07 |
| Woodie | 49.21 | 50.17 | 52.51 | 53.47 | 55.81 | 56.77 | 59.11 |
| Fibonacci | 49.93 | 51.19 | 51.97 | 53.23 | 54.49 | 55.27 | 56.53 |
Numerical data
The following is the status of the technical indicators and moving averages at the time of publication of this technical analysis:
| RSI (14): | 81.00 | |
| MACD (12,26,9): | 1.6400 | |
| Directional Movement: | 33.57 | |
| AROON (14): | 92.86 | |
| DEMA (21): | 56.97 | |
| Parabolic SAR (0,02-0,02-0,2): | 55.43 | |
| Elder Ray (13): | 3.24 | |
| Super Trend (3,10): | 55.94 | |
| Zig ZAG (10): | 58.90 | |
| VORTEX (21): | 1.2400 | |
| Stochastique (14,3,5): | 96.03 | |
| TEMA (21): | 57.79 | |
| Williams %R (14): | -7.13 | |
| Chande Momentum Oscillator (20): | 5.02 | |
| Repulse (5,40,3): | 2.8100 | |
| ROCnROLL: | 1 | |
| TRIX (15,9): | 0.3000 | |
| Courbe Coppock: | 16.61 |
| MA7: | 56.69 | |
| MA20: | 54.32 | |
| MA50: | 52.04 | |
| MA100: | 51.50 | |
| MAexp7: | 57.14 | |
| MAexp20: | 55.01 | |
| MAexp50: | 53.05 | |
| MAexp100: | 52.30 | |
| Price / MA7: | +4.15% | |
| Price / MA20: | +8.69% | |
| Price / MA50: | +13.45% | |
| Price / MA100: | +14.64% | |
| Price / MAexp7: | +3.33% | |
| Price / MAexp20: | +7.33% | |
| Price / MAexp50: | +11.29% | |
| Price / MAexp100: | +12.89% |
News
The latest news and videos published on HUGO BOSS AG NA O.N. at the time of the analysis were as follows:
- HUGO BOSS and Coty Renew License Agreement
- HUGO BOSS Partners With Adobe To Drive 3D Innovation in Fashion
- DGAP-Adhoc: HUGO BOSS AG: HUGO BOSS RAISES FULL YEAR 2022 OUTLOOK AS MOMENTUM FURTHER ACCELERATES IN Q2
- DGAP-AGM: HUGO BOSS AG: Announcement of the Convening of the General Meeting in Bahnhofstrasse 86, 70794 Filderstadt on 24.05.2022 according to article 121 AktG (German Stock Companies Act) with the objective of Europe-wide distribution
- Sentient Brands Holdings Inc.’s Management Team has Experience in Building World-Class Brands such as Hugo Boss, Victoria's Secret, Versace, and Bath & Body Works
About author
Online


Add a comment
Comments
0 comments on the analysis HUGO BOSS AG NA O.N. - Daily