| Open: | - |
| Change: | - |
| Volume: | - |
| Low: | - |
| High: | - |
| High / Low range: | - |
| Type: | Stocks |
| Ticker: | HON |
| ISIN: |
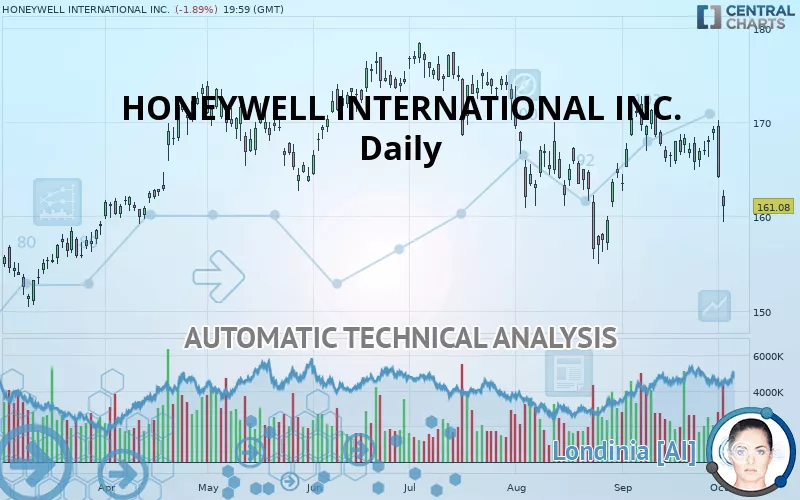
HONEYWELL INTERNATIONAL INC. - Daily - Technical analysis published on 10/03/2019 (GMT)
- 402
- 0
- 10/03/2019 - 09:23
- Who voted?
Click here for a new analysis!
- Timeframe : Daily
- - Analysis generated on 10/03/2019 - 09:21
- Status : INVALID

Summary of the analysis

Additional analysis
Quotes
The HONEYWELL INTERNATIONAL INC. price is 161.08 USD. The price registered a decrease of -1.89% on the session and was traded between 159.44 USD and 162.83 USD over the period. The price is currently at +1.03% from its lowest and -1.07% from its highest.A bearish gap was detected at the opening by the Central Gaps scanner. There are a lot of sellers and they have the upper hand in the very short term.
Opening Gap DOWN
Type : Bearish
Timeframe : Openning
Here is a more detailed summary of the historical variations registered by HONEYWELL INTERNATIONAL INC.:
Near a new HIGH record (5 years)
Type : Bullish
Timeframe : Weekly
Technical
A technical analysis in Daily of this HONEYWELL INTERNATIONAL INC. chart shows a sharp bearish trend. The signals given by moving averages are 82.14% bearish. This strong bearish trend is confirmed by the strong signals currently being given by short-term moving averages. The Central Indicators market scanner is currently detecting several bearish signals that could impact this trend:
Bearish trend reversal : adaptative moving average 20
Type : Bearish
Timeframe : Daily
Bearish trend reversal : adaptative moving average 50
Type : Bearish
Timeframe : Daily
Bearish trend reversal : adaptative moving average 100
Type : Bearish
Timeframe : Daily
Bearish price crossover with Moving Average 20
Type : Bearish
Timeframe : Daily
Bearish price crossover with Moving Average 50
Type : Bearish
Timeframe : Daily
Bearish price crossover with Moving Average 100
Type : Bearish
Timeframe : Daily
Bearish price crossover with adaptative moving average 20
Type : Bearish
Timeframe : Daily
Bearish price crossover with adaptative moving average 50
Type : Bearish
Timeframe : Daily
An assessment of technical indicators shows a bearish signal.
But beware of excesses. The Central Indicators scanner currently detects this:
Williams %R indicator is oversold : under -80
Type : Neutral
Timeframe : Daily
Pivot points : price is under support 1
Type : Neutral
Timeframe : Daily
Pivot points : price is under support 3
Type : Neutral
Timeframe : Weekly
RSI indicator is back under 50
Type : Bearish
Timeframe : Daily
MACD crosses DOWN its Moving Average
Type : Bearish
Timeframe : Daily
Price is back over the pivot point
Type : Bullish
Timeframe : Weekly
Momentum indicator is back under 0
Type : Bearish
Timeframe : Daily
Williams %R indicator is back under -50
Type : Bearish
Timeframe : Daily
Central Patterns, the market scanner focusing on chart patterns, resistances and supports found these results:
Near support of triangle
Type : Bullish
Timeframe : Daily
Horizontal support is broken
Type : Bearish
Timeframe : Daily
Support of channel is broken
Type : Bearish
Timeframe : Daily
For a small setback in the very short term, the Central Candlesticks scanner currently notes the presence of this bearish pattern in Japanese candlesticks:
Bearish engulfing lines
Type : Bearish
Timeframe : Daily
| S3 | S2 | S1 | Price | R1 | R2 | R3 | |
|---|---|---|---|---|---|---|---|
| ProTrendLines | 130.07 | 142.57 | 156.20 | 161.08 | 167.34 | 173.62 | 178.40 |
| Change (%) | -19.25% | -11.49% | -3.03% | - | +3.89% | +7.78% | +10.75% |
| Change | -31.01 | -18.51 | -4.88 | - | +6.26 | +12.54 | +17.32 |
| Level | Minor | Major | Major | - | Major | Major | Major |
To determine price objectives, it is also possible to use the pivot points. Here is the price position in relation to pivot points:
| Pivot points | S3 | S2 | S1 | PP | R1 | R2 | R3 |
|---|---|---|---|---|---|---|---|
| Standard | 155.95 | 159.98 | 162.09 | 166.12 | 168.23 | 172.26 | 174.36 |
| Camarilla | 162.50 | 163.07 | 163.63 | 164.19 | 164.75 | 165.32 | 165.88 |
| Woodie | 154.98 | 159.50 | 161.12 | 165.64 | 167.26 | 171.78 | 173.40 |
| Fibonacci | 159.98 | 162.33 | 163.78 | 166.12 | 168.47 | 169.92 | 172.26 |
| Pivot points | S3 | S2 | S1 | PP | R1 | R2 | R3 |
|---|---|---|---|---|---|---|---|
| Standard | 162.27 | 163.60 | 165.82 | 167.15 | 169.37 | 170.70 | 172.92 |
| Camarilla | 167.06 | 167.39 | 167.72 | 168.04 | 168.37 | 168.69 | 169.02 |
| Woodie | 162.72 | 163.82 | 166.27 | 167.37 | 169.82 | 170.92 | 173.37 |
| Fibonacci | 163.60 | 164.96 | 165.79 | 167.15 | 168.51 | 169.34 | 170.70 |
| Pivot points | S3 | S2 | S1 | PP | R1 | R2 | R3 |
|---|---|---|---|---|---|---|---|
| Standard | 153.58 | 158.11 | 163.66 | 168.19 | 173.74 | 178.27 | 183.82 |
| Camarilla | 166.43 | 167.35 | 168.28 | 169.20 | 170.12 | 171.05 | 171.97 |
| Woodie | 154.08 | 158.37 | 164.16 | 168.45 | 174.24 | 178.53 | 184.32 |
| Fibonacci | 158.11 | 161.96 | 164.34 | 168.19 | 172.04 | 174.42 | 178.27 |
Numerical data
The following is the status of technical indicators and moving averages registered at the time this technical analysis was created:
| RSI (14): | 38.28 | |
| MACD (12,26,9): | -0.3300 | |
| Directional Movement: | -18.27 | |
| AROON (14): | -100.00 | |
| DEMA (21): | 166.10 | |
| Parabolic SAR (0,02-0,02-0,2): | 170.30 | |
| Elder Ray (13): | -5.03 | |
| Super Trend (3,10): | 169.93 | |
| Zig ZAG (10): | 161.08 | |
| VORTEX (21): | 0.8900 | |
| Stochastique (14,3,5): | 25.94 | |
| TEMA (21): | 166.02 | |
| Williams %R (14): | -84.70 | |
| Chande Momentum Oscillator (20): | -5.13 | |
| Repulse (5,40,3): | -3.1300 | |
| ROCnROLL: | 2 | |
| TRIX (15,9): | 0.0300 | |
| Courbe Coppock: | 3.38 |
| MA7: | 166.03 | |
| MA20: | 167.68 | |
| MA50: | 166.26 | |
| MA100: | 168.61 | |
| MAexp7: | 165.43 | |
| MAexp20: | 166.35 | |
| MAexp50: | 166.83 | |
| MAexp100: | 166.11 | |
| Price / MA7: | -2.98% | |
| Price / MA20: | -3.94% | |
| Price / MA50: | -3.12% | |
| Price / MA100: | -4.47% | |
| Price / MAexp7: | -2.63% | |
| Price / MAexp20: | -3.17% | |
| Price / MAexp50: | -3.45% | |
| Price / MAexp100: | -3.03% |
News
The latest news and videos published on HONEYWELL INTERNATIONAL INC. at the time of the analysis were as follows:
- 07/18/2019 - 06:30 Honeywell International, Inc. to Host Earnings Call
- 09/13/2018 - 22:19 Honeywell To Release Third Quarter Financial Results And Hold Its Investor Conference Call On Friday, October 19
- 09/12/2018 - 12:30 Honeywell Spinoff Resideo Announces Key Leadership And Stock Exchange Selection
- 09/07/2018 - 21:03 Honeywell to Present at Gabelli 24th Annual Aerospace and Defense Symposium
- 09/05/2018 - 12:53 Honeywell Board of Directors Declares Spin-off Dividend of Garrett Shares
About author

Online


Add a comment
Comments
0 comments on the analysis HONEYWELL INTERNATIONAL INC. - Daily