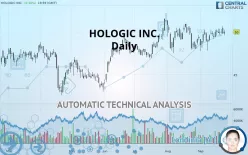
HOLOGIC INC. - Daily - Technical analysis published on 09/25/2019 (GMT)
- 317
- 0
- Who voted?
Click here for a new analysis!
- Timeframe : Daily
- - Analysis generated on
- Status : LEVEL MAINTAINED

Summary of the analysis

Additional analysis
Quotes
The HOLOGIC INC. price is 50.00 USD. The price has increased by +0.30% since the last closing with the lowest point at 49.59 USD and the highest point at 50.22 USD. The deviation from the price is +0.83% for the low point and -0.44% for the high point.The Central Gaps scanner detects a bearish opening marking the presence of sellers ahead of buyers at the opening but not sufficiently marked to allow the price to register a quotation gap.
Bearish opening
Type : Bearish
Timeframe : Openning
So that you have an overall view of the price change, here is a table showing the variations over several periods:
Near a new HIGH record (5 years)
Type : Bullish
Timeframe : Weekly
Near a new HIGH record (1 year)
Type : Bullish
Timeframe : Weekly
Near a new HIGH record (1st january)
Type : Bullish
Timeframe : Weekly
Technical
A technical analysis in Daily of this HOLOGIC INC. chart shows a strongly bullish trend. The signals given by moving averages are 85.71% bullish. This strongly bullish trend seems to be running out of steam given the signals being given by short-term moving averages. The Central Indicators scanner does not detect any result on moving averages that would impact this trend.
In fact, according to the parameters integrated into the Central Analyzer system, 12 technical indicators out of 18 analysed are currently bullish. But beware of excesses. The Central Indicators scanner currently detects this:
Williams %R indicator is overbought : over -20
Type : Neutral
Timeframe : Daily
Price is back over the pivot point
Type : Bullish
Timeframe : Weekly
Price is back under the pivot point
Type : Bearish
Timeframe : Daily
Central Patterns, the market scanner focusing on chart patterns, resistances and supports found these results:
Resistance of channel is broken
Type : Bullish
Timeframe : Daily
Resistance of triangle is broken
Type : Bullish
Timeframe : Daily
Central Candlesticks, the scanner specialised in Japanese candlesticks, detects a bearish signal that could support the hypothesis of a small drop in the very short term:
Bearish engulfing lines
Type : Bearish
Timeframe : Daily
| S3 | S2 | S1 | Price | R1 | |
|---|---|---|---|---|---|
| ProTrendLines | 45.01 | 46.49 | 48.15 | 50.00 | 51.50 |
| Change (%) | -9.98% | -7.02% | -3.70% | - | +3.00% |
| Change | -4.99 | -3.51 | -1.85 | - | +1.50 |
| Level | Minor | Major | Major | - | Major |
To determine price objectives, it is also possible to use the pivot points. Here is the price position in relation to pivot points:
| Pivot points | S3 | S2 | S1 | PP | R1 | R2 | R3 |
|---|---|---|---|---|---|---|---|
| Standard | 48.59 | 49.16 | 49.50 | 50.07 | 50.41 | 50.98 | 51.32 |
| Camarilla | 49.60 | 49.68 | 49.77 | 49.85 | 49.93 | 50.02 | 50.10 |
| Woodie | 48.49 | 49.10 | 49.40 | 50.01 | 50.31 | 50.92 | 51.22 |
| Fibonacci | 49.16 | 49.50 | 49.72 | 50.07 | 50.41 | 50.63 | 50.98 |
| Pivot points | S3 | S2 | S1 | PP | R1 | R2 | R3 |
|---|---|---|---|---|---|---|---|
| Standard | 48.10 | 48.64 | 49.30 | 49.84 | 50.50 | 51.04 | 51.70 |
| Camarilla | 49.62 | 49.73 | 49.84 | 49.95 | 50.06 | 50.17 | 50.28 |
| Woodie | 48.15 | 48.67 | 49.35 | 49.87 | 50.55 | 51.07 | 51.75 |
| Fibonacci | 48.64 | 49.10 | 49.39 | 49.84 | 50.30 | 50.59 | 51.04 |
| Pivot points | S3 | S2 | S1 | PP | R1 | R2 | R3 |
|---|---|---|---|---|---|---|---|
| Standard | 43.71 | 45.62 | 47.50 | 49.41 | 51.29 | 53.20 | 55.08 |
| Camarilla | 48.33 | 48.68 | 49.02 | 49.37 | 49.72 | 50.07 | 50.41 |
| Woodie | 43.69 | 45.61 | 47.48 | 49.40 | 51.27 | 53.19 | 55.06 |
| Fibonacci | 45.62 | 47.07 | 47.97 | 49.41 | 50.86 | 51.76 | 53.20 |
Numerical data
The following is the status of technical indicators and moving averages registered at the time this technical analysis was created:
| RSI (14): | 55.04 | |
| MACD (12,26,9): | 0.2000 | |
| Directional Movement: | -0.97 | |
| AROON (14): | 71.43 | |
| DEMA (21): | 49.90 | |
| Parabolic SAR (0,02-0,02-0,2): | 48.64 | |
| Elder Ray (13): | 0.14 | |
| Super Trend (3,10): | 51.27 | |
| Zig ZAG (10): | 50.00 | |
| VORTEX (21): | 1.0600 | |
| Stochastique (14,3,5): | 78.26 | |
| TEMA (21): | 49.94 | |
| Williams %R (14): | -22.38 | |
| Chande Momentum Oscillator (20): | 1.02 | |
| Repulse (5,40,3): | -0.6200 | |
| ROCnROLL: | 1 | |
| TRIX (15,9): | 0.0400 | |
| Courbe Coppock: | 3.75 |
| MA7: | 49.97 | |
| MA20: | 49.49 | |
| MA50: | 49.49 | |
| MA100: | 48.05 | |
| MAexp7: | 49.89 | |
| MAexp20: | 49.66 | |
| MAexp50: | 49.22 | |
| MAexp100: | 48.32 | |
| Price / MA7: | +0.06% | |
| Price / MA20: | +1.03% | |
| Price / MA50: | +1.03% | |
| Price / MA100: | +4.06% | |
| Price / MAexp7: | +0.22% | |
| Price / MAexp20: | +0.68% | |
| Price / MAexp50: | +1.58% | |
| Price / MAexp100: | +3.48% |
News
Don"t forget to follow the news on HOLOGIC INC.. At the time of publication of this analysis, the latest news was as follows:
- Hologic Announces Financial Results for Third Quarter of Fiscal 2019
- Hologic to Announce Financial Results for the Third Quarter of Fiscal 2019 on Wednesday, July 31, 2019
- Hologic Applauds FDA’s Proposed Rule to Update Mammography Regulations Issued Under the Mammography Quality Standards Act (MQSA) of 1992
- Hologic’s Aptima HIV-1 Quant Dx Assay Receives Two CE Marks, Making It the First and Only Dual-Claim Assay for Both Viral Load and Early Infant Diagnosis
- Recent Analysis Shows The Mosaic, National Health Investors, Capital Senior Living, Independence Contract Drilling, Hologic, and TrueBlue Market Influences — Renewed Outlook, Key Drivers of Growth
About author

Online


Add a comment
Comments
0 comments on the analysis HOLOGIC INC. - Daily