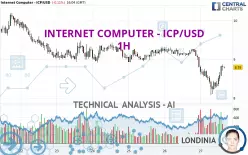
INTERNET COMPUTER - ICP/USD - 1H - Technical analysis published on 01/27/2025 (GMT)
- 90
- 0
Click here for a new analysis!
- Timeframe : 1H
- - Analysis generated on
- Status : INVALID

Summary of the analysis

Additional analysis
Quotes
The INTERNET COMPUTER - ICP/USD price is 8.79 USD. The price registered a decrease of -0.11% on the session and was between 8.07 USD and 8.86 USD. This implies that the price is at +8.92% from its lowest and at -0.79% from its highest.Here is a more detailed summary of the historical variations registered by INTERNET COMPUTER - ICP/USD:
New LOW record (1st january)
Type : Bearish
Timeframe : Weekly
New LOW record (1 month)
Type : Bearish
Timeframe : Weekly
Technical
A technical analysis in 1H of this INTERNET COMPUTER - ICP/USD chart shows a bearish trend. 75.00% of the signals given by moving averages are bearish. Caution: as the signals currently given by short-term moving averages are rather neutral, the bearish trend could slow down. The Central Indicators market scanner currently does not detect any result that concerns moving averages.
In fact, 11 technical indicators on 18 studied are currently positioned bullish. Caution: the Central Indicators scanner currently detects an excess:
Williams %R indicator is overbought : over -20
Type : Neutral
Timeframe : 1 hour
Aroon indicator bullish trend
Type : Bullish
Timeframe : 1 hour
Central Patterns, the market scanner focusing on chart patterns, resistances and supports found this result:
Support of channel is broken
Type : Bearish
Timeframe : 1 hour
Central Candlesticks, the scanner specialised in Japanese candlesticks, detects these bearish signals that could support the hypothesis of a small drop in the very short term:
Bearish harami
Type : Bearish
Timeframe : 1 hour
Bearish harami cross
Type : Bearish
Timeframe : 1 hour
| S3 | S2 | S1 | Price | R1 | R2 | R3 | |
|---|---|---|---|---|---|---|---|
| ProTrendLines | 6.95 | 7.69 | 8.34 | 8.79 | 8.92 | 9.48 | 9.83 |
| Change (%) | -20.93% | -12.51% | -5.12% | - | +1.48% | +7.85% | +11.83% |
| Change | -1.84 | -1.10 | -0.45 | - | +0.13 | +0.69 | +1.04 |
| Level | Major | Minor | Minor | - | Intermediate | Major | Major |
To determine price objectives, it is also possible to use the pivot points. Here is the price position in relation to pivot points:
| Pivot points | S3 | S2 | S1 | PP | R1 | R2 | R3 |
|---|---|---|---|---|---|---|---|
| Standard | 8.09 | 8.44 | 8.62 | 8.97 | 9.15 | 9.50 | 9.68 |
| Camarilla | 8.65 | 8.70 | 8.75 | 8.80 | 8.85 | 8.90 | 8.95 |
| Woodie | 8.01 | 8.40 | 8.54 | 8.93 | 9.07 | 9.46 | 9.60 |
| Fibonacci | 8.44 | 8.64 | 8.77 | 8.97 | 9.17 | 9.30 | 9.50 |
| Pivot points | S3 | S2 | S1 | PP | R1 | R2 | R3 |
|---|---|---|---|---|---|---|---|
| Standard | 6.35 | 7.63 | 8.42 | 9.70 | 10.49 | 11.77 | 12.56 |
| Camarilla | 8.64 | 8.83 | 9.02 | 9.21 | 9.40 | 9.59 | 9.78 |
| Woodie | 6.11 | 7.51 | 8.18 | 9.58 | 10.25 | 11.65 | 12.32 |
| Fibonacci | 7.63 | 8.42 | 8.91 | 9.70 | 10.49 | 10.98 | 11.77 |
| Pivot points | S3 | S2 | S1 | PP | R1 | R2 | R3 |
|---|---|---|---|---|---|---|---|
| Standard | 1.75 | 5.27 | 7.56 | 11.08 | 13.37 | 16.89 | 19.18 |
| Camarilla | 8.26 | 8.80 | 9.33 | 9.86 | 10.39 | 10.93 | 11.46 |
| Woodie | 1.15 | 4.96 | 6.96 | 10.77 | 12.77 | 16.58 | 18.58 |
| Fibonacci | 5.27 | 7.49 | 8.86 | 11.08 | 13.30 | 14.67 | 16.89 |
Numerical data
The following is the status of the technical indicators and moving averages at the time of publication of this technical analysis:
| RSI (14): | 52.00 | |
| MACD (12,26,9): | -0.1100 | |
| Directional Movement: | 0.64 | |
| AROON (14): | 50.00 | |
| DEMA (21): | 8.48 | |
| Parabolic SAR (0,02-0,02-0,2): | 8.15 | |
| Elder Ray (13): | 0.19 | |
| Super Trend (3,10): | 8.22 | |
| Zig ZAG (10): | 8.78 | |
| VORTEX (21): | 0.8800 | |
| Stochastique (14,3,5): | 86.40 | |
| TEMA (21): | 8.47 | |
| Williams %R (14): | -10.53 | |
| Chande Momentum Oscillator (20): | 0.05 | |
| Repulse (5,40,3): | 2.8800 | |
| ROCnROLL: | -1 | |
| TRIX (15,9): | -0.2800 | |
| Courbe Coppock: | 6.17 |
| MA7: | 9.15 | |
| MA20: | 9.98 | |
| MA50: | 10.84 | |
| MA100: | 10.34 | |
| MAexp7: | 8.61 | |
| MAexp20: | 8.66 | |
| MAexp50: | 8.86 | |
| MAexp100: | 9.07 | |
| Price / MA7: | -3.93% | |
| Price / MA20: | -11.92% | |
| Price / MA50: | -18.91% | |
| Price / MA100: | -14.99% | |
| Price / MAexp7: | +2.09% | |
| Price / MAexp20: | +1.50% | |
| Price / MAexp50: | -0.79% | |
| Price / MAexp100: | -3.09% |
About author
Online


Add a comment
Comments
0 comments on the analysis INTERNET COMPUTER - ICP/USD - 1H