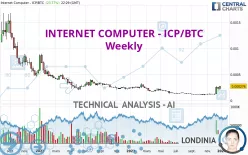
INTERNET COMPUTER - ICP/BTC - Weekly - Technical analysis published on 12/30/2023 (GMT)
- 207
- 0
Click here for a new analysis!
- Timeframe : Weekly
- - Analysis generated on
- Status : INVALID

Summary of the analysis

Additional analysis
Quotes
The INTERNET COMPUTER - ICP/BTC rating is 0.000276 BTC. The price is up +21.05% over 5 days and was traded between 0.000205 BTC and 0.000281 BTC over the period. The price is currently at +34.63% from its lowest point and -1.78% from its highest point.A study of price movements over other periods shows the following variations:
Near a new HIGH record (1 year)
Type : Bullish
Timeframe : Weekly
New HIGH record (1st january)
Type : Bullish
Timeframe : Weekly
Near a new HIGH record (1 month)
Type : Bullish
Timeframe : Weekly
The Central Volumes scanner notes the presence of abnormal volumes:
Abnormal volumes
Timeframe : 5 days
Abnormal volumes
Timeframe : 20 days
Abnormal volumes
Timeframe : 50 days
Technical
A technical analysis in Weekly of this INTERNET COMPUTER - ICP/BTC chart shows a neutral trend. The strong bullish signals currently being given by short-term moving averages could allow the overall trend to return to bullish. An assessment of moving averages reveals several bullish signals that could impact this trend:
Moving Average bullish crossovers : AMA20 & AMA50
Type : Bullish
Timeframe : Weekly
Bullish price crossover with Moving Average 100
Type : Bullish
Timeframe : Weekly
In fact, according to the parameters integrated into the Central Analyzer system, 15 technical indicators out of 18 analysed are currently bullish. Caution: the Central Indicators scanner currently detects an excess:
RSI indicator is overbought : over 70
Type : Neutral
Timeframe : Weekly
CCI indicator is overbought : over 100
Type : Neutral
Timeframe : Weekly
Williams %R indicator is overbought : over -20
Type : Neutral
Timeframe : Weekly
Pivot points : price is over resistance 1
Type : Neutral
Timeframe : Weekly
Ichimoku : price is over the cloud
Type : Bullish
Timeframe : Weekly
The analysis of the price chart with Central Patterns scanners does not return any result.
The presence of a bullish Japanese candlestick pattern detected by Central Candlesticks that could cause a very short term rebound was also detected:
Bullish engulfing lines
Type : Bullish
Timeframe : Weekly
| S2 | S1 | Price | R1 | R2 | R3 | |
|---|---|---|---|---|---|---|
| ProTrendLines | 0.000103 | 0.000210 | 0.000276 | 0.000303 | 0.000385 | 0.000681 |
| Change (%) | -62.68% | -23.91% | - | +9.78% | +39.49% | +146.74% |
| Change | -0.000173 | -0.000066 | - | +0.000027 | +0.000109 | +0.000405 |
| Level | Intermediate | Major | - | Intermediate | Minor | Minor |
Attention could also be paid to pivot points to set price objectives:
| Pivot points | S3 | S2 | S1 | PP | R1 | R2 | R3 |
|---|---|---|---|---|---|---|---|
| Standard | 0.000201 | 0.000209 | 0.000216 | 0.000224 | 0.000231 | 0.000239 | 0.000246 |
| Camarilla | 0.000219 | 0.000220 | 0.000222 | 0.000223 | 0.000224 | 0.000226 | 0.000227 |
| Woodie | 0.000201 | 0.000209 | 0.000216 | 0.000224 | 0.000231 | 0.000239 | 0.000246 |
| Fibonacci | 0.000209 | 0.000215 | 0.000218 | 0.000224 | 0.000230 | 0.000233 | 0.000239 |
| Pivot points | S3 | S2 | S1 | PP | R1 | R2 | R3 |
|---|---|---|---|---|---|---|---|
| Standard | 0.000101 | 0.000149 | 0.000183 | 0.000231 | 0.000265 | 0.000313 | 0.000347 |
| Camarilla | 0.000196 | 0.000203 | 0.000211 | 0.000218 | 0.000226 | 0.000233 | 0.000241 |
| Woodie | 0.000095 | 0.000146 | 0.000177 | 0.000228 | 0.000259 | 0.000310 | 0.000341 |
| Fibonacci | 0.000149 | 0.000180 | 0.000199 | 0.000231 | 0.000262 | 0.000281 | 0.000313 |
| Pivot points | S3 | S2 | S1 | PP | R1 | R2 | R3 |
|---|---|---|---|---|---|---|---|
| Standard | 0.000087 | 0.000099 | 0.000110 | 0.000122 | 0.000133 | 0.000145 | 0.000156 |
| Camarilla | 0.000115 | 0.000117 | 0.000119 | 0.000121 | 0.000123 | 0.000125 | 0.000127 |
| Woodie | 0.000087 | 0.000099 | 0.000110 | 0.000122 | 0.000133 | 0.000145 | 0.000156 |
| Fibonacci | 0.000099 | 0.000108 | 0.000113 | 0.000122 | 0.000131 | 0.000136 | 0.000145 |
Numerical data
The following is the status of technical indicators and moving averages registered at the time this technical analysis was created:
| RSI (14): | 73.48 | |
| MACD (12,26,9): | 0.0000 | |
| Directional Movement: | 28.885839 | |
| AROON (14): | 50.000000 | |
| DEMA (21): | 0.000169 | |
| Parabolic SAR (0,02-0,02-0,2): | 0.000122 | |
| Elder Ray (13): | 0.000068 | |
| Super Trend (3,10): | 0.000129 | |
| Zig ZAG (10): | 0.000273 | |
| VORTEX (21): | 1.1222 | |
| Stochastique (14,3,5): | 84.17 | |
| TEMA (21): | 0.000202 | |
| Williams %R (14): | -2.23 | |
| Chande Momentum Oscillator (20): | 0.000165 | |
| Repulse (5,40,3): | 55.0810 | |
| ROCnROLL: | 1 | |
| TRIX (15,9): | -0.6500 | |
| Courbe Coppock: | 115.68 |
| MA7: | 0.000230 | |
| MA20: | 0.000205 | |
| MA50: | 0.000155 | |
| MA100: | 0.000133 | |
| MAexp7: | 0.000199 | |
| MAexp20: | 0.000160 | |
| MAexp50: | 0.000191 | |
| MAexp100: | 0.000319 | |
| Price / MA7: | +20.00% | |
| Price / MA20: | +34.63% | |
| Price / MA50: | +78.06% | |
| Price / MA100: | +107.52% | |
| Price / MAexp7: | +38.69% | |
| Price / MAexp20: | +72.50% | |
| Price / MAexp50: | +44.50% | |
| Price / MAexp100: | -13.48% |
About author

Online


Add a comment
Comments
0 comments on the analysis INTERNET COMPUTER - ICP/BTC - Weekly