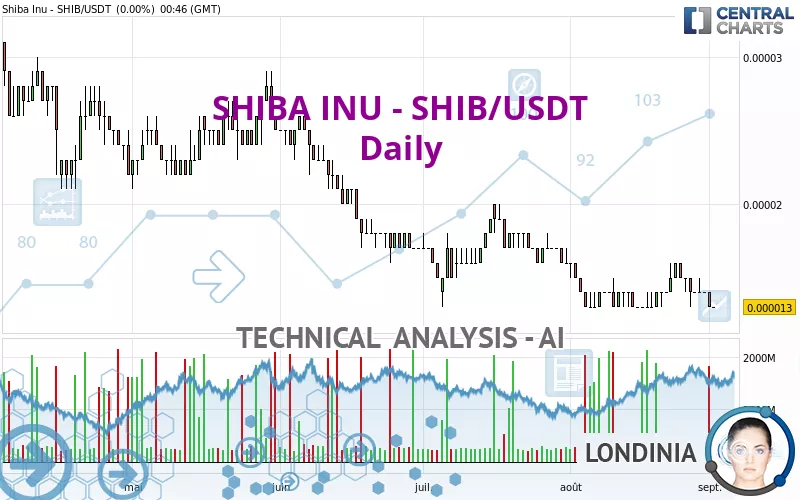
SHIBA INU - SHIB/USDT - Daily - Technical analysis published on 09/02/2024 (GMT)
- 166
- 0
Click here for a new analysis!
- Timeframe : Daily
- - Analysis generated on
- Status : INVALID

Summary of the analysis

Additional analysis
Quotes
The SHIBA INU - SHIB/USDT price is 0.000013 USDT. The price has increased by +0.00% since the last closing with the lowest point at 0.000013 USDT and the highest point at 0.000013 USDT. The deviation from the price is 0% for the low point and 0% for the high point.So that you have an overall view of the price change, here is a table showing the variations over several periods:
New LOW record (1 month)
Type : Bearish
Timeframe : Weekly
The Central Volumes scanner notes the presence of abnormal volumes:
Abnormal volumes
Timeframe : 5 days
Abnormal volumes
Timeframe : 20 days
Abnormal volumes
Timeframe : 50 days
Technical
Technical analysis of SHIBA INU - SHIB/USDT in Daily shows a overall strongly bearish trend. The signals given by moving averages are 92.86% bearish. This strong bearish trend is confirmed by the strong signals currently being given by short-term moving averages. The Central Indicators scanner does not detect any result on moving averages that would impact this trend.
In fact, according to the parameters integrated into the Central Analyzer system, only 9 technical indicators out of 18 analysed are currently bearish. Caution: the Central Indicators scanner currently detects an excess:
CCI indicator is oversold : under -100
Type : Neutral
Timeframe : Daily
Williams %R indicator is oversold : under -80
Type : Neutral
Timeframe : Daily
Pivot points : price is under support 1
Type : Neutral
Timeframe : Weekly
MACD crosses DOWN its Moving Average
Type : Bearish
Timeframe : Daily
Central Patterns, the scanner specializing in chart patterns, did not identify any signals.
Central Candlesticks, the scanner specialised in Japanese candlesticks, detects this inversion signal that could impact the current short-term trend:
Doji
Type : Neutral
Timeframe : Daily
| S2 | S1 | Price | R1 | R2 | R3 | |
|---|---|---|---|---|---|---|
| ProTrendLines | 0.000009 | 0.000013 | 0.000013 | 0.000017 | 0.000022 | 0.000028 |
| Change (%) | -30.77% | 0% | - | +30.77% | +69.23% | +115.38% |
| Change | -0.000004 | 0 | - | +0.000004 | +0.000009 | +0.000015 |
| Level | Intermediate | Minor | - | Minor | Intermediate | Minor |
To determine price objectives, it is also possible to use the pivot points. Here is the price position in relation to pivot points:
| Pivot points | S3 | S2 | S1 | PP | R1 | R2 | R3 |
|---|---|---|---|---|---|---|---|
| Standard | 0.000012 | 0.000012 | 0.000013 | 0.000013 | 0.000014 | 0.000014 | 0.000015 |
| Camarilla | 0.000013 | 0.000013 | 0.000013 | 0.000013 | 0.000013 | 0.000013 | 0.000013 |
| Woodie | 0.000012 | 0.000012 | 0.000013 | 0.000013 | 0.000014 | 0.000014 | 0.000015 |
| Fibonacci | 0.000012 | 0.000013 | 0.000013 | 0.000013 | 0.000014 | 0.000014 | 0.000014 |
| Pivot points | S3 | S2 | S1 | PP | R1 | R2 | R3 |
|---|---|---|---|---|---|---|---|
| Standard | 0.000010 | 0.000011 | 0.000013 | 0.000014 | 0.000016 | 0.000017 | 0.000019 |
| Camarilla | 0.000013 | 0.000014 | 0.000014 | 0.000014 | 0.000014 | 0.000015 | 0.000015 |
| Woodie | 0.000010 | 0.000011 | 0.000013 | 0.000014 | 0.000016 | 0.000017 | 0.000019 |
| Fibonacci | 0.000011 | 0.000013 | 0.000013 | 0.000014 | 0.000016 | 0.000016 | 0.000017 |
Numerical data
The following is the status of the technical indicators and moving averages at the time of publication of this technical analysis:
| RSI (14): | 37.60 | |
| MACD (12,26,9): | 0.0000 | |
| Directional Movement: | -3.662548 | |
| AROON (14): | 28.571429 | |
| DEMA (21): | 0.000014 | |
| Parabolic SAR (0,02-0,02-0,2): | 0.000016 | |
| Elder Ray (13): | -0.000001 | |
| Super Trend (3,10): | 0.000013 | |
| Zig ZAG (10): | 0.000013 | |
| VORTEX (21): | 1.0000 | |
| Stochastique (14,3,5): | 11.11 | |
| TEMA (21): | 0.000014 | |
| Williams %R (14): | -100.00 | |
| Chande Momentum Oscillator (20): | -0.000001 | |
| Repulse (5,40,3): | -7.9364 | |
| ROCnROLL: | 2 | |
| TRIX (15,9): | -0.2759 | |
| Courbe Coppock: | 6.11 |
| MA7: | 0.000014 | |
| MA20: | 0.000014 | |
| MA50: | 0.000015 | |
| MA100: | 0.000018 | |
| MAexp7: | 0.000014 | |
| MAexp20: | 0.000014 | |
| MAexp50: | 0.000015 | |
| MAexp100: | 0.000017 | |
| Price / MA7: | -7.14% | |
| Price / MA20: | -7.14% | |
| Price / MA50: | -13.33% | |
| Price / MA100: | -27.78% | |
| Price / MAexp7: | -7.14% | |
| Price / MAexp20: | -7.14% | |
| Price / MAexp50: | -13.33% | |
| Price / MAexp100: | -23.53% |
About author

Online


Add a comment
Comments
0 comments on the analysis SHIBA INU - SHIB/USDT - Daily