SHIBA INU - SHIB/USDT - Daily - Technical analysis published on 03/29/2022 (GMT)
- 308
- 0
Click here for a new analysis!
- Timeframe : Daily
- - Analysis generated on
- Status : INVALID

Summary of the analysis

Additional analysis
Quotes
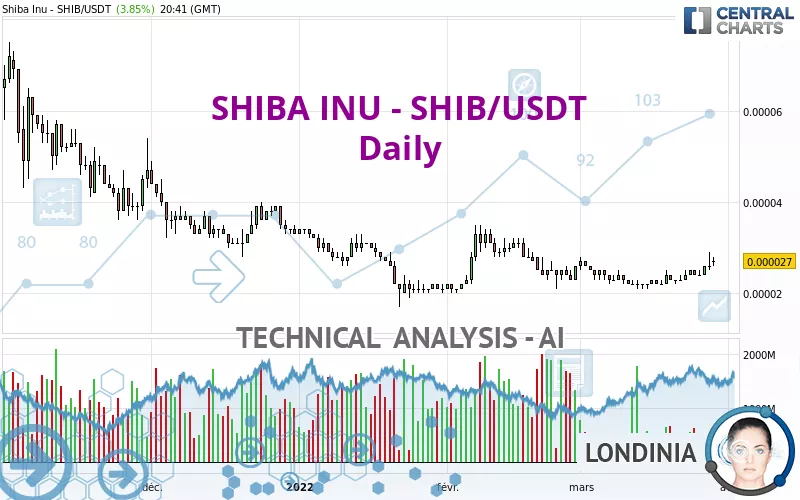
The SHIBA INU - SHIB/USDT rating is 0.000027 USDT. The price registered an increase of +3.85% on the session and was between 0.000026 USDT and 0.000028 USDT. This implies that the price is at +3.85% from its lowest and at -3.57% from its highest.So that you have an overall view of the price change, here is a table showing the variations over several periods:
Near a new HIGH record (1 month)
Type : Bullish
Timeframe : Weekly
The Central Volumes scanner notes the presence of abnormal volumes:
Abnormal volumes
Timeframe : 5 days
Abnormal volumes
Timeframe : 20 days
Abnormal volumes
Timeframe : 50 days
Technical
Technical analysis of SHIBA INU - SHIB/USDT in Daily shows an overall slightly bullish trend. 50.00% of the signals given by moving averages are bullish. The overall trend could accelerate as strong bullish signals from short-term moving averages are expected. The Central Indicators market scanner is currently detecting several bearish and bullish signals that could impact this trend:
Bearish trend reversal : Moving Average 50
Type : Bearish
Timeframe : Daily
Bullish price crossover with Moving Average 100
Type : Bullish
Timeframe : Daily
Technical indicators are strongly bullish, suggesting that the price increase should continue.
Caution: the Central Indicators scanner currently detects an excess:
CCI indicator is overbought : over 100
Type : Neutral
Timeframe : Daily
Pivot points : price is over resistance 2
Type : Neutral
Timeframe : Weekly
Ichimoku : price is over the cloud
Type : Bullish
Timeframe : Daily
SuperTrend indicator bullish reversal
Type : Bullish
Timeframe : Daily
Price is back over the pivot point
Type : Bullish
Timeframe : Daily
The analysis of the price chart with Central Patterns scanners does not return any result.
The Central Candlesticks scanner which studies Japanese candlesticks did not detect anything.
| S2 | S1 | Price | R1 | R2 | R3 | |
|---|---|---|---|---|---|---|
| ProTrendLines | 0.000007 | 0.000021 | 0.000027 | 0.000031 | 0.000047 | 0.000065 |
| Change (%) | -74.07% | -22.22% | - | +14.81% | +74.07% | +140.74% |
| Change | -0.000020 | -0.000006 | - | +0.000004 | +0.000020 | +0.000038 |
| Level | Minor | Major | - | Intermediate | Minor | Minor |
Pivot points can also be used to set your price objectives. Here is the price situation in relation to pivot points:
| Pivot points | S3 | S2 | S1 | PP | R1 | R2 | R3 |
|---|---|---|---|---|---|---|---|
| Standard | 0.000020 | 0.000023 | 0.000024 | 0.000027 | 0.000028 | 0.000031 | 0.000032 |
| Camarilla | 0.000025 | 0.000025 | 0.000026 | 0.000026 | 0.000026 | 0.000027 | 0.000027 |
| Woodie | 0.000020 | 0.000023 | 0.000024 | 0.000027 | 0.000028 | 0.000031 | 0.000032 |
| Fibonacci | 0.000023 | 0.000024 | 0.000025 | 0.000027 | 0.000028 | 0.000029 | 0.000031 |
| Pivot points | S3 | S2 | S1 | PP | R1 | R2 | R3 |
|---|---|---|---|---|---|---|---|
| Standard | 0.000019 | 0.000021 | 0.000022 | 0.000024 | 0.000025 | 0.000027 | 0.000028 |
| Camarilla | 0.000023 | 0.000024 | 0.000024 | 0.000024 | 0.000024 | 0.000025 | 0.000025 |
| Woodie | 0.000020 | 0.000021 | 0.000023 | 0.000024 | 0.000026 | 0.000027 | 0.000029 |
| Fibonacci | 0.000021 | 0.000022 | 0.000023 | 0.000024 | 0.000025 | 0.000026 | 0.000027 |
| Pivot points | S3 | S2 | S1 | PP | R1 | R2 | R3 |
|---|---|---|---|---|---|---|---|
| Standard | 0.000006 | 0.000013 | 0.000020 | 0.000027 | 0.000034 | 0.000041 | 0.000048 |
| Camarilla | 0.000022 | 0.000023 | 0.000025 | 0.000026 | 0.000027 | 0.000029 | 0.000030 |
| Woodie | 0.000005 | 0.000013 | 0.000019 | 0.000027 | 0.000033 | 0.000041 | 0.000047 |
| Fibonacci | 0.000013 | 0.000019 | 0.000022 | 0.000027 | 0.000033 | 0.000036 | 0.000041 |
Numerical data
The following is the status of the technical indicators and moving averages at the time of publication of this technical analysis:
| RSI (14): | 63.23 | |
| MACD (12,26,9): | 0.0000 | |
| Directional Movement: | 18.864475 | |
| AROON (14): | 92.857143 | |
| DEMA (21): | 0.000025 | |
| Parabolic SAR (0,02-0,02-0,2): | 0.000022 | |
| Elder Ray (13): | 0.000002 | |
| Super Trend (3,10): | 0.000022 | |
| Zig ZAG (10): | 0.000027 | |
| VORTEX (21): | 1.0938 | |
| Stochastique (14,3,5): | 77.98 | |
| TEMA (21): | 0.000025 | |
| Williams %R (14): | -28.57 | |
| Chande Momentum Oscillator (20): | 0.000005 | |
| Repulse (5,40,3): | 2.5284 | |
| ROCnROLL: | 1 | |
| TRIX (15,9): | -0.1385 | |
| Courbe Coppock: | 25.84 |
| MA7: | 0.000025 | |
| MA20: | 0.000023 | |
| MA50: | 0.000025 | |
| MA100: | 0.000027 | |
| MAexp7: | 0.000025 | |
| MAexp20: | 0.000024 | |
| MAexp50: | 0.000025 | |
| MAexp100: | 0.000026 | |
| Price / MA7: | +8.00% | |
| Price / MA20: | +17.39% | |
| Price / MA50: | +8.00% | |
| Price / MA100: | -0% | |
| Price / MAexp7: | +8.00% | |
| Price / MAexp20: | +12.50% | |
| Price / MAexp50: | +8.00% | |
| Price / MAexp100: | +3.85% |
About author

Online


Add a comment
Comments
0 comments on the analysis SHIBA INU - SHIB/USDT - Daily