SHIBA INU - SHIB/USDT - Daily - Technical analysis published on 02/10/2022 (GMT)
- 265
- 0
Click here for a new analysis!
- Timeframe : Daily
- - Analysis generated on
- Status : INVALID

Summary of the analysis

Additional analysis
Quotes
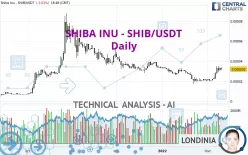
The SHIBA INU - SHIB/USDT price is 0.000032 USDT. On the day, this instrument lost -3.03% and was between 0.000031 USDT and 0.000034 USDT. This implies that the price is at +3.23% from its lowest and at -5.88% from its highest.A study of price movements over other periods shows the following variations:
Near a new HIGH record (1st january)
Type : Bullish
Timeframe : Weekly
Near a new HIGH record (1 month)
Type : Bullish
Timeframe : Weekly
The Central Volumes scanner notes the presence of abnormal volumes:
Abnormal volumes
Timeframe : 5 days
Abnormal volumes
Timeframe : 20 days
Abnormal volumes
Timeframe : 50 days
Technical
Technical analysis of SHIBA INU - SHIB/USDT in Daily shows a neutral overall trend. The trend could quickly turn bullish due to the strong bullish signals currently being given by short-term moving averages. There is no crossing of moving average by the price or crossing of moving averages between themselves.
In fact, 14 technical indicators on 18 studied are currently positioned bullish. Caution: the Central Indicators scanner currently detects an excess:
CCI indicator is overbought : over 100
Type : Neutral
Timeframe : Daily
Previous candle closed over Bollinger bands
Type : Neutral
Timeframe : Daily
RSI indicator: bearish divergence
Type : Bearish
Timeframe : Daily
Williams %R indicator is overbought : over -20
Type : Neutral
Timeframe : Daily
Pivot points : price is over resistance 3
Type : Neutral
Timeframe : Weekly
Price is back under the pivot point
Type : Bearish
Timeframe : Daily
No signals are given by Central Patterns, a market scanner specialised in chart patterns, resistances and supports.
The Central Candlesticks scanner which studies Japanese candlesticks did not detect anything.
| S3 | S2 | S1 | Price | R1 | R2 | R3 | |
|---|---|---|---|---|---|---|---|
| ProTrendLines | 0.000007 | 0.000021 | 0.000027 | 0.000032 | 0.000039 | 0.000047 | 0.000065 |
| Change (%) | -78.13% | -34.38% | -15.63% | - | +21.88% | +46.88% | +103.13% |
| Change | -0.000025 | -0.000011 | -0.000005 | - | +0.000007 | +0.000015 | +0.000033 |
| Level | Minor | Intermediate | Minor | - | Intermediate | Minor | Minor |
Attention could also be paid to pivot points to set price objectives:
| Pivot points | S3 | S2 | S1 | PP | R1 | R2 | R3 |
|---|---|---|---|---|---|---|---|
| Standard | 0.000027 | 0.000028 | 0.000031 | 0.000032 | 0.000035 | 0.000036 | 0.000039 |
| Camarilla | 0.000032 | 0.000032 | 0.000033 | 0.000033 | 0.000033 | 0.000034 | 0.000034 |
| Woodie | 0.000027 | 0.000029 | 0.000031 | 0.000033 | 0.000035 | 0.000037 | 0.000039 |
| Fibonacci | 0.000028 | 0.000030 | 0.000031 | 0.000032 | 0.000034 | 0.000035 | 0.000036 |
| Pivot points | S3 | S2 | S1 | PP | R1 | R2 | R3 |
|---|---|---|---|---|---|---|---|
| Standard | 0.000017 | 0.000018 | 0.000021 | 0.000022 | 0.000025 | 0.000026 | 0.000029 |
| Camarilla | 0.000022 | 0.000022 | 0.000023 | 0.000023 | 0.000023 | 0.000024 | 0.000024 |
| Woodie | 0.000017 | 0.000019 | 0.000021 | 0.000023 | 0.000025 | 0.000027 | 0.000029 |
| Fibonacci | 0.000018 | 0.000020 | 0.000021 | 0.000022 | 0.000024 | 0.000025 | 0.000026 |
| Pivot points | S3 | S2 | S1 | PP | R1 | R2 | R3 |
|---|---|---|---|---|---|---|---|
| Standard | -0.000003 | 0.000007 | 0.000014 | 0.000024 | 0.000031 | 0.000041 | 0.000048 |
| Camarilla | 0.000016 | 0.000018 | 0.000019 | 0.000021 | 0.000023 | 0.000024 | 0.000026 |
| Woodie | -0.000005 | 0.000006 | 0.000013 | 0.000023 | 0.000030 | 0.000040 | 0.000047 |
| Fibonacci | 0.000007 | 0.000014 | 0.000018 | 0.000024 | 0.000031 | 0.000035 | 0.000041 |
Numerical data
The following is the status of the technical indicators and moving averages at the time of publication of this technical analysis:
| RSI (14): | 64.09 | |
| MACD (12,26,9): | 0.0000 | |
| Directional Movement: | 17.541384 | |
| AROON (14): | 78.571429 | |
| DEMA (21): | 0.000027 | |
| Parabolic SAR (0,02-0,02-0,2): | 0.000021 | |
| Elder Ray (13): | 0.000006 | |
| Super Trend (3,10): | 0.000022 | |
| Zig ZAG (10): | 0.000032 | |
| VORTEX (21): | 1.0769 | |
| Stochastique (14,3,5): | 80.00 | |
| TEMA (21): | 0.000030 | |
| Williams %R (14): | -20.00 | |
| Chande Momentum Oscillator (20): | 0.000010 | |
| Repulse (5,40,3): | 8.5956 | |
| ROCnROLL: | 1 | |
| TRIX (15,9): | -0.4911 | |
| Courbe Coppock: | 71.17 |
| MA7: | 0.000029 | |
| MA20: | 0.000024 | |
| MA50: | 0.000028 | |
| MA100: | 0.000036 | |
| MAexp7: | 0.000029 | |
| MAexp20: | 0.000027 | |
| MAexp50: | 0.000028 | |
| MAexp100: | 0.000029 | |
| Price / MA7: | +10.34% | |
| Price / MA20: | +33.33% | |
| Price / MA50: | +14.29% | |
| Price / MA100: | -11.11% | |
| Price / MAexp7: | +10.34% | |
| Price / MAexp20: | +18.52% | |
| Price / MAexp50: | +14.29% | |
| Price / MAexp100: | +10.34% |
About author

Online


Add a comment
Comments
0 comments on the analysis SHIBA INU - SHIB/USDT - Daily