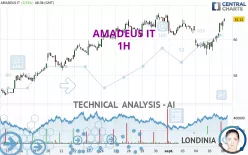
AMADEUS IT - 1H - Technical analysis published on 09/06/2024 (GMT)
- 157
- 0
Click here for a new analysis!
- Timeframe : 1H
- - Analysis generated on
- Status : TARGET REACHED

Summary of the analysis

Additional analysis
Quotes
AMADEUS IT rating 61.12 EUR. The price registered an increase of +0.53% on the session and was traded between 60.52 EUR and 61.18 EUR over the period. The price is currently at +0.99% from its lowest and -0.10% from its highest.The Central Gaps scanner detects a bearish opening. A small advantage for sellers in the very short term.
Bearish opening
Type : Bearish
Timeframe : Openning
Here is a more detailed summary of the historical variations registered by AMADEUS IT:
Near a new HIGH record (1 month)
Type : Bullish
Timeframe : Weekly
Technical
Technical analysis of this 1H chart of AMADEUS IT indicates that the overall trend is strongly bullish. 85.71% of the signals given by moving averages are bullish. The overall trend is supported by the strong bullish signals from short-term moving averages. An assessment of moving averages reveals a bullish signal that could impact this trend:
Bullish trend reversal : Moving Average 50
Type : Bullish
Timeframe : 1 hour
The probability of a further increase is high given the direction of the technical indicators.
Caution: the Central Indicators scanner currently detects an excess:
CCI indicator is overbought : over 100
Type : Neutral
Timeframe : 1 hour
Williams %R indicator is overbought : over -20
Type : Neutral
Timeframe : 1 hour
Central Patterns, the market scanner focusing on chart patterns, resistances and supports found these results:
Near horizontal resistance
Type : Bearish
Timeframe : 1 hour
Resistance of channel is broken
Type : Bullish
Timeframe : 1 hour
No result was found by the Central Candlesticks scanner on Japanese candlesticks.
| S3 | S2 | S1 | Price | R1 | R2 | R3 | |
|---|---|---|---|---|---|---|---|
| ProTrendLines | 58.74 | 60.17 | 60.68 | 61.12 | 62.30 | 63.69 | 65.23 |
| Change (%) | -3.89% | -1.55% | -0.72% | - | +1.93% | +4.20% | +6.72% |
| Change | -2.38 | -0.95 | -0.44 | - | +1.18 | +2.57 | +4.11 |
| Level | Major | Intermediate | Intermediate | - | Minor | Intermediate | Intermediate |
To determine price objectives, it is also possible to use the pivot points. Here is the price position in relation to pivot points:
| Pivot points | S3 | S2 | S1 | PP | R1 | R2 | R3 |
|---|---|---|---|---|---|---|---|
| Standard | 58.21 | 58.79 | 59.79 | 60.37 | 61.37 | 61.95 | 62.95 |
| Camarilla | 60.37 | 60.51 | 60.66 | 60.80 | 60.95 | 61.09 | 61.24 |
| Woodie | 58.43 | 58.90 | 60.01 | 60.48 | 61.59 | 62.06 | 63.17 |
| Fibonacci | 58.79 | 59.39 | 59.76 | 60.37 | 60.97 | 61.34 | 61.95 |
| Pivot points | S3 | S2 | S1 | PP | R1 | R2 | R3 |
|---|---|---|---|---|---|---|---|
| Standard | 57.95 | 58.75 | 59.85 | 60.65 | 61.75 | 62.55 | 63.65 |
| Camarilla | 60.42 | 60.59 | 60.77 | 60.94 | 61.11 | 61.29 | 61.46 |
| Woodie | 58.09 | 58.83 | 59.99 | 60.73 | 61.89 | 62.63 | 63.79 |
| Fibonacci | 58.75 | 59.48 | 59.93 | 60.65 | 61.38 | 61.83 | 62.55 |
| Pivot points | S3 | S2 | S1 | PP | R1 | R2 | R3 |
|---|---|---|---|---|---|---|---|
| Standard | 49.85 | 52.27 | 56.61 | 59.03 | 63.37 | 65.79 | 70.13 |
| Camarilla | 59.08 | 59.70 | 60.32 | 60.94 | 61.56 | 62.18 | 62.80 |
| Woodie | 50.80 | 52.75 | 57.56 | 59.51 | 64.32 | 66.27 | 71.08 |
| Fibonacci | 52.27 | 54.86 | 56.45 | 59.03 | 61.62 | 63.21 | 65.79 |
Numerical data
The following are the details of the technical indicators and moving averages that were collected to generate this technical analysis:
| RSI (14): | 67.04 | |
| MACD (12,26,9): | 0.1300 | |
| Directional Movement: | 1.73 | |
| AROON (14): | 85.71 | |
| DEMA (21): | 60.44 | |
| Parabolic SAR (0,02-0,02-0,2): | 59.73 | |
| Elder Ray (13): | 0.60 | |
| Super Trend (3,10): | 60.11 | |
| Zig ZAG (10): | 61.10 | |
| VORTEX (21): | 1.0800 | |
| Stochastique (14,3,5): | 97.41 | |
| TEMA (21): | 60.67 | |
| Williams %R (14): | 0.00 | |
| Chande Momentum Oscillator (20): | 1.42 | |
| Repulse (5,40,3): | 1.1300 | |
| ROCnROLL: | 1 | |
| TRIX (15,9): | -0.0200 | |
| Courbe Coppock: | 2.85 |
| MA7: | 60.69 | |
| MA20: | 59.37 | |
| MA50: | 60.06 | |
| MA100: | 61.31 | |
| MAexp7: | 60.68 | |
| MAexp20: | 60.35 | |
| MAexp50: | 60.33 | |
| MAexp100: | 60.06 | |
| Price / MA7: | +0.71% | |
| Price / MA20: | +2.95% | |
| Price / MA50: | +1.76% | |
| Price / MA100: | -0.31% | |
| Price / MAexp7: | +0.73% | |
| Price / MAexp20: | +1.28% | |
| Price / MAexp50: | +1.31% | |
| Price / MAexp100: | +1.76% |
News
The last news published on AMADEUS IT at the time of the generation of this analysis was as follows:
- SUNRATE integrates with Outpayce from Amadeus
- SUNRATE integrates with Outpayce from Amadeus
- Gant Travel Pioneers in North America With the Launch of Cytric Easy by Amadeus
- Amadeus and Emburse to Simplify Travel and Expense for Global Enterprises with Strategic Partnership
- Travel Industry to Benefit From Enhanced Flight Search and Booking From Cirium and Amadeus Deal
About author
Online


Add a comment
Comments
0 comments on the analysis AMADEUS IT - 1H