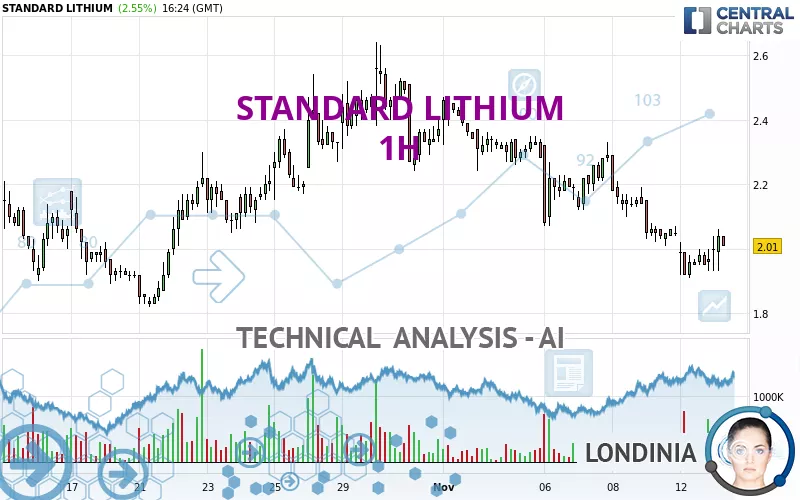
STANDARD LITHIUM - 1H - Technical analysis published on 11/13/2024 (GMT)
- 115
- 0
Click here for a new analysis!
- Timeframe : 1H
- - Analysis generated on
- Status : TARGET REACHED
Summary of the analysis

Additional analysis
Quotes
The STANDARD LITHIUM rating is 2.01 USD. On the day, this instrument gained +2.55% with the lowest point at 1.93 USD and the highest point at 2.06 USD. The deviation from the price is +4.15% for the low point and -2.43% for the high point.The Central Gaps scanner detects a bullish opening. A small advantage for buyers in the very short term.
Bullish opening
Type : Bullish
Timeframe : Openning
So that you have an overall view of the price change, here is a table showing the variations over several periods:
Abnormal volumes
Timeframe : 50 days
Technical
Technical analysis of this 1H chart of STANDARD LITHIUM indicates that the overall trend is strongly bearish. 89.29% of the signals given by moving averages are bearish. This strongly bearish trend is showing signs of slowing down given the slightly bearish signals given by short-term moving averages. The Central Indicators scanner detects a bullish signal on moving averages that could impact this trend:
Bullish price crossover with Moving Average 20
Type : Bullish
Timeframe : 1 hour
The probability of a further increase is slight given the direction of the technical indicators.
But beware of excesses. The Central Indicators scanner currently detects this:
Williams %R indicator is overbought : over -20
Type : Neutral
Timeframe : 1 hour
Pivot points : price is under support 1
Type : Neutral
Timeframe : Weekly
The Central Patterns scanner, which studies chart patterns, resistances and supports, has identified these signals:
Near support of channel
Type : Bullish
Timeframe : 1 hour
Near support of triangle
Type : Bullish
Timeframe : 1 hour
The presence of a bullish Japanese candlestick pattern detected by Central Candlesticks that could cause a very short term rebound was also detected:
Bullish engulfing lines
Type : Bullish
Timeframe : 1 hour
| S3 | S2 | S1 | Price | R1 | R2 | R3 | |
|---|---|---|---|---|---|---|---|
| ProTrendLines | 1.45 | 1.69 | 1.90 | 2.01 | 2.22 | 2.33 | 2.51 |
| Change (%) | -27.86% | -15.92% | -5.47% | - | +10.45% | +15.92% | +24.88% |
| Change | -0.56 | -0.32 | -0.11 | - | +0.21 | +0.32 | +0.50 |
| Level | Intermediate | Intermediate | Major | - | Minor | Intermediate | Major |
Attention could also be paid to pivot points to set price objectives:
| Pivot points | S3 | S2 | S1 | PP | R1 | R2 | R3 |
|---|---|---|---|---|---|---|---|
| Standard | 1.80 | 1.85 | 1.91 | 1.96 | 2.02 | 2.07 | 2.13 |
| Camarilla | 1.93 | 1.94 | 1.95 | 1.96 | 1.97 | 1.98 | 1.99 |
| Woodie | 1.80 | 1.85 | 1.91 | 1.96 | 2.02 | 2.07 | 2.13 |
| Fibonacci | 1.85 | 1.90 | 1.92 | 1.96 | 2.01 | 2.03 | 2.07 |
| Pivot points | S3 | S2 | S1 | PP | R1 | R2 | R3 |
|---|---|---|---|---|---|---|---|
| Standard | 1.74 | 1.90 | 2.04 | 2.20 | 2.34 | 2.50 | 2.64 |
| Camarilla | 2.09 | 2.12 | 2.14 | 2.17 | 2.20 | 2.23 | 2.25 |
| Woodie | 1.72 | 1.90 | 2.02 | 2.20 | 2.32 | 2.50 | 2.62 |
| Fibonacci | 1.90 | 2.02 | 2.09 | 2.20 | 2.32 | 2.39 | 2.50 |
| Pivot points | S3 | S2 | S1 | PP | R1 | R2 | R3 |
|---|---|---|---|---|---|---|---|
| Standard | 0.59 | 1.05 | 1.71 | 2.17 | 2.83 | 3.29 | 3.95 |
| Camarilla | 2.05 | 2.16 | 2.26 | 2.36 | 2.46 | 2.57 | 2.67 |
| Woodie | 0.68 | 1.10 | 1.80 | 2.22 | 2.92 | 3.34 | 4.04 |
| Fibonacci | 1.05 | 1.48 | 1.75 | 2.17 | 2.60 | 2.87 | 3.29 |
Numerical data
The following are the details of the technical indicators and moving averages that were collected to generate this technical analysis:
| RSI (14): | 49.32 | |
| MACD (12,26,9): | -0.0500 | |
| Directional Movement: | -8.15 | |
| AROON (14): | -57.14 | |
| DEMA (21): | 1.96 | |
| Parabolic SAR (0,02-0,02-0,2): | 1.91 | |
| Elder Ray (13): | -0.01 | |
| Super Trend (3,10): | 2.13 | |
| Zig ZAG (10): | 2.03 | |
| VORTEX (21): | 0.8400 | |
| Stochastique (14,3,5): | 51.05 | |
| TEMA (21): | 1.95 | |
| Williams %R (14): | -15.63 | |
| Chande Momentum Oscillator (20): | 0.00 | |
| Repulse (5,40,3): | 4.5200 | |
| ROCnROLL: | -1 | |
| TRIX (15,9): | -0.4300 | |
| Courbe Coppock: | 10.83 |
| MA7: | 2.14 | |
| MA20: | 2.19 | |
| MA50: | 1.82 | |
| MA100: | 1.54 | |
| MAexp7: | 2.00 | |
| MAexp20: | 2.04 | |
| MAexp50: | 2.13 | |
| MAexp100: | 2.16 | |
| Price / MA7: | -6.07% | |
| Price / MA20: | -8.22% | |
| Price / MA50: | +10.44% | |
| Price / MA100: | +30.52% | |
| Price / MAexp7: | +0.50% | |
| Price / MAexp20: | -1.47% | |
| Price / MAexp50: | -5.63% | |
| Price / MAexp100: | -6.94% |
News
The latest news and videos published on STANDARD LITHIUM at the time of the analysis were as follows:
- Standard Lithium Reports Fiscal First Quarter 2025 Results
- SWA Lithium and Koch Technology Solutions Sign License for First Commercial DLE Project in North America
- Standard Lithium Reports 2024 Full Year and Fourth Quarter Results
- Arkansas Governor, Local and Community Leaders Congratulate Standard Lithium, Equinor for U.S. Department of Energy Provisional Grant up to US$225 million
- U.S. Department of Energy Selects Standard Lithium and Equinor for Award Negotiation of Up to $225 Million for South West Arkansas Project
About author
Online


Add a comment
Comments
0 comments on the analysis STANDARD LITHIUM - 1H