EIDF overview
EIDF
> Analyses

 Thank you
Reply
Chart
Thank you
Reply
Chart
Londinia
has published a new analysis.
- 0
- 89212
- 15470
- 0
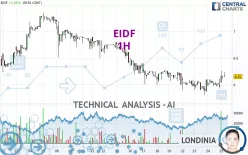
Timeframe : 1H - Simple chart
Status : IN PROGRESS...
The bullish trend is currently very strong on EIDF. As long as the price remains above the support at , you could try to benefit from the boom. The first bullish objective is located at . The…
EIDF
> Analyses
 Thank you
Reply
Chart
Thank you
Reply
Chart
Londinia
has published a new analysis.
- 0
- 89212
- 15470
- 0
Timeframe : 1H - Simple chart
Status : NEUTRAL
The short-term increase on EIDF remains moderate but could challenge the slightly bearish basic trend. It is difficult to advise a trading direction under these conditions. The first resistance is…
EIDF
> Analyses
 Thank you
Reply
Chart
Thank you
Reply
Chart
Londinia
has published a new analysis.
- 0
- 89212
- 15470
- 0
Timeframe : 1H - Simple chart
Status : INVALID
The strong short-term increase in EIDF calls into question the currently slightly bearish basic trend. A trend reversal is likely. As long as the price remains above 6.03 EUR, you could consider…
EIDF
> Analyses
 Thank you
Reply
Chart
Thank you
Reply
Chart
Londinia
has published a new analysis.
- 0
- 89212
- 15470
- 0
Timeframe : 1H - Simple chart
Status : TARGET REACHED
EIDF is part of a very strong bearish trend. Traders may consider trading only short positions (for sale) as long as the price remains well below 9.20 EUR. The next support located at 8.84 EUR is the…
EIDF
> Analyses
 Thank you
Reply
Chart
Thank you
Reply
Chart
Londinia
has published a new analysis.
- 0
- 89212
- 15470
- 0
Timeframe : 1H - Simple chart
Status : TARGET REACHED
The bullish trend is currently very strong on EIDF. As long as the price remains above the support at 22.12 EUR, you could try to benefit from the boom. The first bullish objective is located at 23.04…

