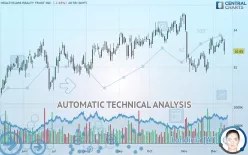
HEALTHCARE REALTY TRUST INC. - Daily - Technical analysis published on 12/12/2019 (GMT)
- 265
- 0
- Who voted?
- Timeframe : Daily
- - Analysis generated on
- Status : NEUTRAL

Summary of the analysis

Additional analysis
Quotes
HEALTHCARE REALTY TRUST INC. rating 32.85 USD. The price registered a decrease of -1.65% on the session and was between 32.67 USD and 33.49 USD. This implies that the price is at +0.55% from its lowest and at -1.91% from its highest.The Central Gaps scanner detects a bearish opening marking the presence of sellers ahead of buyers at the opening but not sufficiently marked to allow the price to register a quotation gap.
Bearish opening
Type : Bearish
Timeframe : Openning
Here is a more detailed summary of the historical variations registered by HEALTHCARE REALTY TRUST INC.:
Near a new HIGH record (5 years)
Type : Bullish
Timeframe : Weekly
Near a new HIGH record (1 year)
Type : Bullish
Timeframe : Weekly
Near a new HIGH record (1st january)
Type : Bullish
Timeframe : Weekly
Technical
A technical analysis in Daily of this HEALTHCARE REALTY TRUST INC. chart shows a slightly bullish trend. 57.14% of the signals given by moving averages are bullish. As the signals currently given by short-term moving averages are rather neutral, the slightly bullish trend could return to neutral. The Central Indicators market scanner is currently detecting several bearish signals that could impact this trend:
Bearish price crossover with Moving Average 50
Type : Bearish
Timeframe : Daily
Bearish price crossover with adaptative moving average 20
Type : Bearish
Timeframe : Daily
An assessment of technical indicators does not currently provide any relevant information to suggest whether the signal given by the technical indicators is more bullish or bearish.
But beware of excesses. The Central Indicators scanner currently detects this:
Williams %R indicator is overbought : over -20
Type : Neutral
Timeframe : Daily
Pivot points : price is under support 3
Type : Neutral
Timeframe : Daily
RSI indicator is back under 50
Type : Bearish
Timeframe : Daily
Ichimoku : price is under the cloud
Type : Bearish
Timeframe : Daily
Price is back over the pivot point
Type : Bullish
Timeframe : Weekly
No signals are given by Central Patterns, a market scanner specialised in chart patterns, resistances and supports.
The Central Candlesticks scanner, specialised in Japanese candlesticks, did not identify any signals.
| S3 | S2 | S1 | Price | R1 | R2 | R3 | |
|---|---|---|---|---|---|---|---|
| ProTrendLines | 30.81 | 31.49 | 32.80 | 32.85 | 33.17 | 34.07 | 34.77 |
| Change (%) | -6.21% | -4.14% | -0.15% | - | +0.97% | +3.71% | +5.84% |
| Change | -2.04 | -1.36 | -0.05 | - | +0.32 | +1.22 | +1.92 |
| Level | Minor | Major | Major | - | Major | Major | Major |
Attention could also be paid to pivot points to set price objectives:
| Pivot points | S3 | S2 | S1 | PP | R1 | R2 | R3 |
|---|---|---|---|---|---|---|---|
| Standard | 32.95 | 33.13 | 33.27 | 33.45 | 33.59 | 33.77 | 33.91 |
| Camarilla | 33.31 | 33.34 | 33.37 | 33.40 | 33.43 | 33.46 | 33.49 |
| Woodie | 32.92 | 33.12 | 33.24 | 33.44 | 33.56 | 33.76 | 33.88 |
| Fibonacci | 33.13 | 33.26 | 33.33 | 33.45 | 33.58 | 33.65 | 33.77 |
| Pivot points | S3 | S2 | S1 | PP | R1 | R2 | R3 |
|---|---|---|---|---|---|---|---|
| Standard | 32.05 | 32.38 | 32.79 | 33.12 | 33.53 | 33.86 | 34.27 |
| Camarilla | 33.01 | 33.07 | 33.14 | 33.21 | 33.28 | 33.35 | 33.41 |
| Woodie | 32.10 | 32.40 | 32.84 | 33.14 | 33.58 | 33.88 | 34.32 |
| Fibonacci | 32.38 | 32.66 | 32.83 | 33.12 | 33.40 | 33.57 | 33.86 |
| Pivot points | S3 | S2 | S1 | PP | R1 | R2 | R3 |
|---|---|---|---|---|---|---|---|
| Standard | 28.42 | 29.93 | 31.54 | 33.05 | 34.67 | 36.18 | 37.80 |
| Camarilla | 32.30 | 32.59 | 32.87 | 33.16 | 33.45 | 33.73 | 34.02 |
| Woodie | 28.47 | 29.95 | 31.60 | 33.08 | 34.72 | 36.21 | 37.85 |
| Fibonacci | 29.93 | 31.12 | 31.86 | 33.05 | 34.25 | 34.99 | 36.18 |
Numerical data
The following are the details of the technical indicators and moving averages that were collected to generate this technical analysis:
| RSI (14): | 48.73 | |
| MACD (12,26,9): | 0.1000 | |
| Directional Movement: | -2.92 | |
| AROON (14): | 71.42 | |
| DEMA (21): | 33.03 | |
| Parabolic SAR (0,02-0,02-0,2): | 32.43 | |
| Elder Ray (13): | 0.06 | |
| Super Trend (3,10): | 32.10 | |
| Zig ZAG (10): | 32.85 | |
| VORTEX (21): | 1.0600 | |
| Stochastique (14,3,5): | 75.65 | |
| TEMA (21): | 33.20 | |
| Williams %R (14): | -43.14 | |
| Chande Momentum Oscillator (20): | 1.04 | |
| Repulse (5,40,3): | -2.2600 | |
| ROCnROLL: | 2 | |
| TRIX (15,9): | 0.0000 | |
| Courbe Coppock: | 5.57 |
| MA7: | 33.20 | |
| MA20: | 32.76 | |
| MA50: | 33.10 | |
| MA100: | 32.79 | |
| MAexp7: | 33.13 | |
| MAexp20: | 32.96 | |
| MAexp50: | 32.91 | |
| MAexp100: | 32.67 | |
| Price / MA7: | -1.05% | |
| Price / MA20: | +0.27% | |
| Price / MA50: | -0.76% | |
| Price / MA100: | +0.18% | |
| Price / MAexp7: | -0.85% | |
| Price / MAexp20: | -0.33% | |
| Price / MAexp50: | -0.18% | |
| Price / MAexp100: | +0.55% |
News
The latest news and videos published on HEALTHCARE REALTY TRUST INC. at the time of the analysis were as follows:
- Healthcare Realty Trust Incorporated to Host Earnings Call
- Healthcare Realty Trust Incorporated to Host Earnings Call
-
 Healthcare Realty Trust
- Healthcare Realty Trust Announces Fourth Quarter Dividend
- Healthcare Realty Trust Announces Fourth Quarter Earnings Release Date and Conference Call
About author

Online


Add a comment
Comments
0 comments on the analysis HEALTHCARE REALTY TRUST INC. - Daily