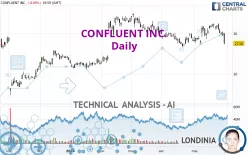
CONFLUENT INC. - Daily - Technical analysis published on 05/31/2024 (GMT)
- 121
- 0
Click here for a new analysis!
- Timeframe : Daily
- - Analysis generated on
- Status : TARGET REACHED

Summary of the analysis

Additional analysis
Quotes
The CONFLUENT INC. rating is 27.56 USD. On the day, this instrument lost -8.89% with the lowest point at 27.33 USD and the highest point at 30.10 USD. The deviation from the price is +0.84% for the low point and -8.44% for the high point.So that you have an overall view of the price change, here is a table showing the variations over several periods:
New LOW record (1 month)
Type : Bearish
Timeframe : Weekly
Technical
Technical analysis of CONFLUENT INC. in Daily shows an overall slightly bearish trend. 60.71% of the signals given by moving averages are bearish. This slightly bearish trend could be reinforced by the strong bearish signals given by short-term moving averages. The Central Indicators market scanner is currently detecting several bearish signals that could impact this trend:
Bearish price crossover with Moving Average 50
Type : Bearish
Timeframe : Daily
Bearish price crossover with Moving Average 100
Type : Bearish
Timeframe : Daily
Bearish price crossover with adaptative moving average 20
Type : Bearish
Timeframe : Daily
Bearish price crossover with adaptative moving average 50
Type : Bearish
Timeframe : Daily
Bearish price crossover with adaptative moving average 100
Type : Bearish
Timeframe : Daily
In fact, Central Analyzer took into account 18 technical indicators and the result was as follows: 4 are bullish, 6 are neutral and 8 are bearish. Caution: the Central Indicators scanner currently detects an excess:
CCI indicator is oversold : under -100
Type : Neutral
Timeframe : Daily
Williams %R indicator is oversold : under -80
Type : Neutral
Timeframe : Daily
Pivot points : price is under support 3
Type : Neutral
Timeframe : Daily
Pivot points : price is under support 3
Type : Neutral
Timeframe : Weekly
Ichimoku : price is under the cloud
Type : Bearish
Timeframe : Daily
SuperTrend indicator bearish reversal
Type : Bearish
Timeframe : Daily
Momentum indicator is back under 0
Type : Bearish
Timeframe : Daily
Central Patterns, the scanner specializing in chart patterns, did not identify any signals.
The Central Candlesticks scanner, specialised in Japanese candlesticks, did not identify any signals.
| S3 | S2 | S1 | Price | R1 | R2 | R3 | |
|---|---|---|---|---|---|---|---|
| ProTrendLines | 17.84 | 21.55 | 25.72 | 27.56 | 27.83 | 32.13 | 34.27 |
| Change (%) | -35.27% | -21.81% | -6.68% | - | +0.98% | +16.58% | +24.35% |
| Change | -9.72 | -6.01 | -1.84 | - | +0.27 | +4.57 | +6.71 |
| Level | Intermediate | Intermediate | Intermediate | - | Major | Intermediate | Major |
Attention could also be paid to pivot points to set price objectives:
| Pivot points | S3 | S2 | S1 | PP | R1 | R2 | R3 |
|---|---|---|---|---|---|---|---|
| Standard | 23.79 | 25.56 | 26.56 | 28.33 | 29.33 | 31.10 | 32.10 |
| Camarilla | 26.80 | 27.05 | 27.31 | 27.56 | 27.81 | 28.07 | 28.32 |
| Woodie | 23.41 | 25.37 | 26.18 | 28.14 | 28.95 | 30.91 | 31.72 |
| Fibonacci | 25.56 | 26.62 | 27.27 | 28.33 | 29.39 | 30.04 | 31.10 |
| Pivot points | S3 | S2 | S1 | PP | R1 | R2 | R3 |
|---|---|---|---|---|---|---|---|
| Standard | 26.82 | 28.45 | 29.30 | 30.93 | 31.78 | 33.41 | 34.26 |
| Camarilla | 29.47 | 29.70 | 29.92 | 30.15 | 30.38 | 30.61 | 30.83 |
| Woodie | 26.43 | 28.26 | 28.91 | 30.74 | 31.39 | 33.22 | 33.87 |
| Fibonacci | 28.45 | 29.40 | 29.98 | 30.93 | 31.88 | 32.46 | 33.41 |
| Pivot points | S3 | S2 | S1 | PP | R1 | R2 | R3 |
|---|---|---|---|---|---|---|---|
| Standard | 21.31 | 23.91 | 26.02 | 28.62 | 30.73 | 33.33 | 35.44 |
| Camarilla | 26.83 | 27.26 | 27.69 | 28.12 | 28.55 | 28.98 | 29.42 |
| Woodie | 21.06 | 23.79 | 25.77 | 28.50 | 30.48 | 33.21 | 35.19 |
| Fibonacci | 23.91 | 25.71 | 26.82 | 28.62 | 30.42 | 31.53 | 33.33 |
Numerical data
The following are the details of the technical indicators and moving averages that were collected to generate this technical analysis:
| RSI (14): | 37.78 | |
| MACD (12,26,9): | 0.0900 | |
| Directional Movement: | -11.34 | |
| AROON (14): | -28.57 | |
| DEMA (21): | 30.36 | |
| Parabolic SAR (0,02-0,02-0,2): | 32.38 | |
| Elder Ray (13): | -1.48 | |
| Super Trend (3,10): | 32.80 | |
| Zig ZAG (10): | 27.56 | |
| VORTEX (21): | 0.9000 | |
| Stochastique (14,3,5): | 25.60 | |
| TEMA (21): | 30.35 | |
| Williams %R (14): | -95.60 | |
| Chande Momentum Oscillator (20): | -2.40 | |
| Repulse (5,40,3): | -12.0200 | |
| ROCnROLL: | 2 | |
| TRIX (15,9): | 0.2100 | |
| Courbe Coppock: | 4.88 |
| MA7: | 30.33 | |
| MA20: | 30.28 | |
| MA50: | 29.71 | |
| MA100: | 29.02 | |
| MAexp7: | 29.87 | |
| MAexp20: | 30.15 | |
| MAexp50: | 29.82 | |
| MAexp100: | 29.22 | |
| Price / MA7: | -9.13% | |
| Price / MA20: | -8.98% | |
| Price / MA50: | -7.24% | |
| Price / MA100: | -5.03% | |
| Price / MAexp7: | -7.73% | |
| Price / MAexp20: | -8.59% | |
| Price / MAexp50: | -7.58% | |
| Price / MAexp100: | -5.68% |
About author

Online


Add a comment
Comments
0 comments on the analysis CONFLUENT INC. - Daily