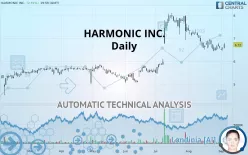
HARMONIC INC. - Daily - Technical analysis published on 09/06/2019 (GMT)
- 343
- 0
- Who voted?
Click here for a new analysis!
- Timeframe : Daily
- - Analysis generated on
- Status : TARGET REACHED

Summary of the analysis

Additional analysis
Quotes
The HARMONIC INC. rating is 6.72 USD. The price has increased by +2.91% since the last closing and was traded between 6.55 USD and 6.79 USD over the period. The price is currently at +2.60% from its lowest and -1.03% from its highest.A bullish opening was detected by the Central Gaps scanner. Buyers are trying to impose a bullish momentum in the very short term.
Bullish opening
Type : Bullish
Timeframe : Openning
So that you have an overall view of the price change, here is a table showing the variations over several periods:
Near a new LOW record (1 month)
Type : Bearish
Timeframe : Weekly
Abnormal volumes on HARMONIC INC. were detected by the Central Volumes scanner:
Abnormal volumes
Timeframe : 50 days
Technical
Technical analysis of this Daily chart of HARMONIC INC. indicates that the overall trend is bullish. The signals given by moving averages are 64.29% bullish. This bullish trend could slow down given the slightly bearish signals currently being given by short-term moving averages. The Central Indicators market scanner currently does not detect any result that concerns moving averages.
The probability of a further increase is slight given the direction of the technical indicators.
Caution: the Central Indicators scanner currently detects an excess:
Williams %R indicator is overbought : over -20
Type : Neutral
Timeframe : Daily
Pivot points : price is over resistance 2
Type : Neutral
Timeframe : Daily
Price is back under the pivot point
Type : Bearish
Timeframe : Daily
Williams %R indicator is back over -50
Type : Bullish
Timeframe : Daily
The analysis of the price chart with Central Patterns scanners does not return any result.
No result was found by the Central Candlesticks scanner on Japanese candlesticks.
| S3 | S2 | S1 | Price | R1 | R2 | R3 | |
|---|---|---|---|---|---|---|---|
| ProTrendLines | 5.69 | 6.14 | 6.46 | 6.72 | 6.93 | 7.52 | 7.97 |
| Change (%) | -15.33% | -8.63% | -3.87% | - | +3.13% | +11.90% | +18.60% |
| Change | -1.03 | -0.58 | -0.26 | - | +0.21 | +0.80 | +1.25 |
| Level | Intermediate | Major | Intermediate | - | Intermediate | Intermediate | Major |
To determine price objectives, it is also possible to use the pivot points. Here is the price position in relation to pivot points:
| Pivot points | S3 | S2 | S1 | PP | R1 | R2 | R3 |
|---|---|---|---|---|---|---|---|
| Standard | 6.31 | 6.38 | 6.46 | 6.53 | 6.61 | 6.68 | 6.76 |
| Camarilla | 6.49 | 6.50 | 6.52 | 6.53 | 6.54 | 6.56 | 6.57 |
| Woodie | 6.31 | 6.38 | 6.46 | 6.53 | 6.61 | 6.68 | 6.76 |
| Fibonacci | 6.38 | 6.44 | 6.48 | 6.53 | 6.59 | 6.63 | 6.68 |
| Pivot points | S3 | S2 | S1 | PP | R1 | R2 | R3 |
|---|---|---|---|---|---|---|---|
| Standard | 6.04 | 6.24 | 6.41 | 6.61 | 6.78 | 6.98 | 7.15 |
| Camarilla | 6.49 | 6.52 | 6.56 | 6.59 | 6.62 | 6.66 | 6.69 |
| Woodie | 6.04 | 6.23 | 6.41 | 6.60 | 6.78 | 6.97 | 7.15 |
| Fibonacci | 6.24 | 6.38 | 6.47 | 6.61 | 6.75 | 6.84 | 6.98 |
| Pivot points | S3 | S2 | S1 | PP | R1 | R2 | R3 |
|---|---|---|---|---|---|---|---|
| Standard | 5.03 | 5.73 | 6.16 | 6.86 | 7.29 | 7.99 | 8.42 |
| Camarilla | 6.28 | 6.38 | 6.49 | 6.59 | 6.69 | 6.80 | 6.90 |
| Woodie | 4.90 | 5.66 | 6.03 | 6.79 | 7.16 | 7.92 | 8.29 |
| Fibonacci | 5.73 | 6.16 | 6.43 | 6.86 | 7.29 | 7.56 | 7.99 |
Numerical data
The following are the details of the technical indicators and moving averages that were collected to generate this technical analysis:
| RSI (14): | 47.96 | |
| MACD (12,26,9): | -0.1200 | |
| Directional Movement: | -7.47 | |
| AROON (14): | -21.43 | |
| DEMA (21): | 6.61 | |
| Parabolic SAR (0,02-0,02-0,2): | 6.46 | |
| Elder Ray (13): | 0 | |
| Super Trend (3,10): | 7.14 | |
| Zig ZAG (10): | 6.72 | |
| VORTEX (21): | 0.8100 | |
| Stochastique (14,3,5): | 29.41 | |
| TEMA (21): | 6.43 | |
| Williams %R (14): | -43.14 | |
| Chande Momentum Oscillator (20): | -0.05 | |
| Repulse (5,40,3): | 1.2900 | |
| ROCnROLL: | 1 | |
| TRIX (15,9): | -0.2500 | |
| Courbe Coppock: | 8.33 |
| MA7: | 6.60 | |
| MA20: | 6.74 | |
| MA50: | 6.92 | |
| MA100: | 6.22 | |
| MAexp7: | 6.62 | |
| MAexp20: | 6.75 | |
| MAexp50: | 6.70 | |
| MAexp100: | 6.39 | |
| Price / MA7: | +1.82% | |
| Price / MA20: | -0.30% | |
| Price / MA50: | -2.89% | |
| Price / MA100: | +8.04% | |
| Price / MAexp7: | +1.51% | |
| Price / MAexp20: | -0.44% | |
| Price / MAexp50: | +0.30% | |
| Price / MAexp100: | +5.16% |
News
The latest news and videos published on HARMONIC INC. at the time of the analysis were as follows:
- Harmonic Brings Real-World OTT and Broadcast Success to IBC2019
- Harmonic Announces Second Quarter 2019 Results
-
 Harmonic Inc. - HLIT Stock Chart Technical Analysis for 07-10-2019
- Harmonic Announces Reporting Date for Second Quarter 2019 Financial Results
- Harmonic Enables Guangdong Radio and Television to Deliver Premium UHD Broadcasts in China
About author

Online


Add a comment
Comments
0 comments on the analysis HARMONIC INC. - Daily